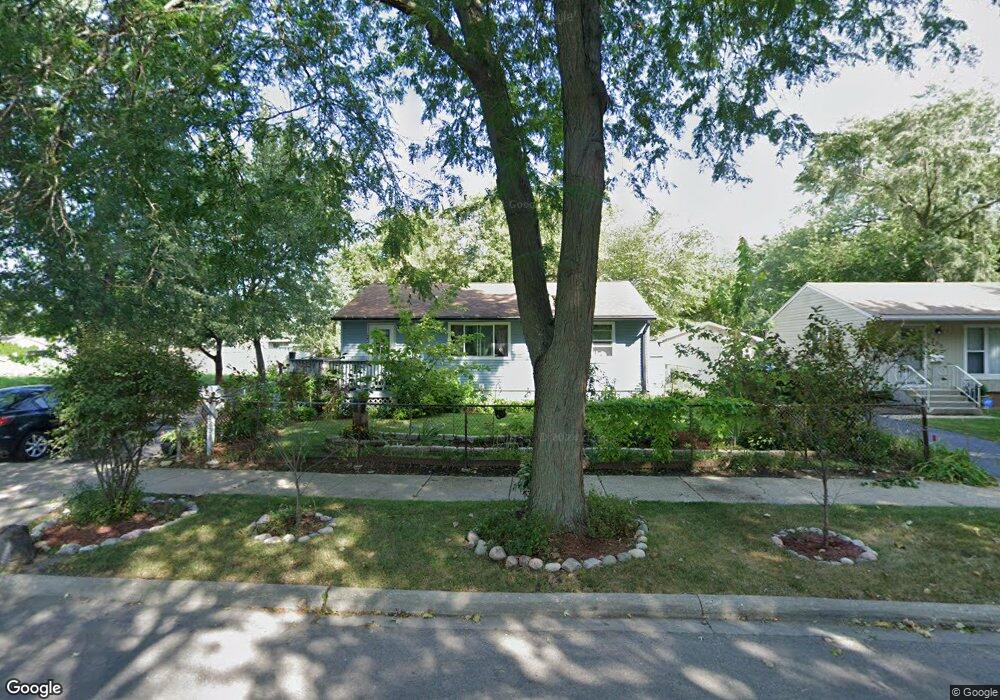
2829 Yeoman St Waukegan, IL 60087
Lake County Gardens NeighborhoodEstimated Value: $204,000 - $227,956
3
Beds
1
Bath
864
Sq Ft
$248/Sq Ft
Est. Value
About This Home
This home is located at 2829 Yeoman St, Waukegan, IL 60087 and is currently estimated at $214,239, approximately $247 per square foot. 2829 Yeoman St is a home located in Lake County with nearby schools including Little Fort Elementary School, Jack Benny Middle School, and Waukegan High School.
Ownership History
Date
Name
Owned For
Owner Type
Purchase Details
Closed on
Jul 28, 2024
Sold by
Ubo Holdings Llc
Bought by
Jimenez Brisel C
Current Estimated Value
Purchase Details
Closed on
Feb 2, 2023
Sold by
Jimenez Atala
Bought by
Ubo Holdings Llc
Purchase Details
Closed on
Mar 29, 2019
Sold by
Alberta Jimenez Neptali and Alberta Castredy
Bought by
Jimenez Atala and Jimenez Brisen
Purchase Details
Closed on
Aug 30, 2000
Sold by
Lanier Ronald James and Lanier Sheri L
Bought by
Jimenez Neptali and Castrejon Alberta
Home Financials for this Owner
Home Financials are based on the most recent Mortgage that was taken out on this home.
Original Mortgage
$113,068
Interest Rate
7.96%
Mortgage Type
FHA
Purchase Details
Closed on
Dec 23, 1999
Sold by
Lanier Ronald James and Lanier Sheri L
Bought by
Lanier Ronald James and Lanier Sheri L
Home Financials for this Owner
Home Financials are based on the most recent Mortgage that was taken out on this home.
Original Mortgage
$66,500
Interest Rate
7.69%
Create a Home Valuation Report for This Property
The Home Valuation Report is an in-depth analysis detailing your home's value as well as a comparison with similar homes in the area
Home Values in the Area
Average Home Value in this Area
Purchase History
| Date | Buyer | Sale Price | Title Company |
|---|---|---|---|
| Jimenez Brisel C | -- | None Listed On Document | |
| Ubo Holdings Llc | -- | -- | |
| Jimenez Atala | -- | First American Title | |
| Jimenez Neptali | $114,000 | Chicago Title Insurance Co | |
| Lanier Ronald James | -- | First American Title |
Source: Public Records
Mortgage History
| Date | Status | Borrower | Loan Amount |
|---|---|---|---|
| Previous Owner | Jimenez Neptali | $113,068 | |
| Previous Owner | Lanier Ronald James | $66,500 |
Source: Public Records
Tax History Compared to Growth
Tax History
| Year | Tax Paid | Tax Assessment Tax Assessment Total Assessment is a certain percentage of the fair market value that is determined by local assessors to be the total taxable value of land and additions on the property. | Land | Improvement |
|---|---|---|---|---|
| 2024 | $4,434 | $60,909 | $8,344 | $52,565 |
| 2023 | $3,912 | $55,025 | $7,538 | $47,487 |
| 2022 | $3,912 | $46,015 | $7,182 | $38,833 |
| 2021 | $3,568 | $40,221 | $6,217 | $34,004 |
| 2020 | $3,567 | $37,471 | $5,792 | $31,679 |
| 2019 | $3,538 | $34,336 | $5,307 | $29,029 |
| 2018 | $2,750 | $27,652 | $6,761 | $20,891 |
| 2017 | $2,627 | $24,465 | $5,982 | $18,483 |
| 2016 | $2,358 | $21,259 | $5,198 | $16,061 |
| 2015 | $2,201 | $19,027 | $4,652 | $14,375 |
| 2014 | $2,539 | $20,547 | $4,745 | $15,802 |
| 2012 | $3,367 | $22,260 | $5,141 | $17,119 |
Source: Public Records
Map
Nearby Homes
- 1612 Whitney St
- 1636 Rice St
- 2613 N Lewis Ave
- 2350 N Lewis Ave
- 37905 N Loyola Ave
- 37966 N Cornell Rd
- 3211 Rugby Ct
- 2232 Walnut St
- 301 W Eagle Ct
- 3411 N Lewis Ave
- 38127 N Shore Ave
- 38362 N Manor Ave
- 0 Traditions Dr
- 10241 W Bairstow Ave
- 3101 Country Club Ln
- 2708 Dana Ave
- 2705 Dana Ave
- 12312 W Audrey Ave
- 1905 Linden Ave
- 2713 Varonen Ave
- 2825 Yeoman St
- 2826 N Butrick St
- 2830 N Butrick St
- 2822 N Butrick St
- 2817 Yeoman St
- 2818 N Butrick St
- 1601 Frazier St
- 2813 Yeoman St
- 2824 Yeoman St Unit 4
- 2814 N Butrick St
- 2816 Yeoman St
- 2809 Yeoman St
- 1605 Frazier St
- 2829 N Butrick St
- 2833 N Butrick St Unit 4
- 2825 N Butrick St
- 2810 N Butrick St
- 2837 N Butrick St
- 2810 Yeoman St
- 2817 N Butrick St