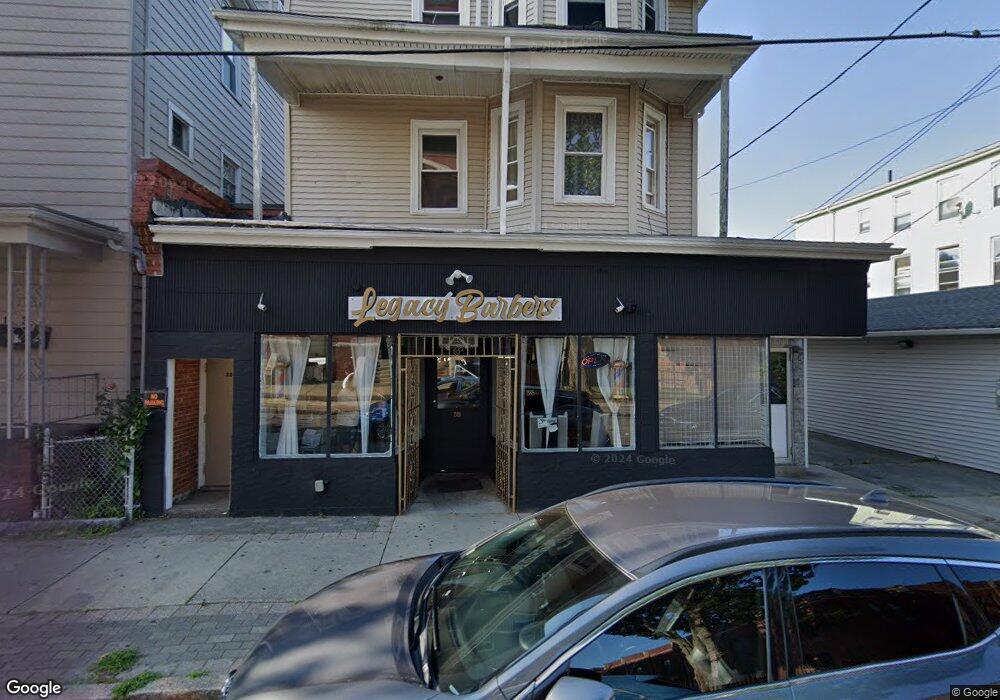
283-285 Rivet St New Bedford, MA 02744
The South End NeighborhoodEstimated Value: $269,608
6
Beds
5
Baths
2,712
Sq Ft
$99/Sq Ft
Est. Value
About This Home
This home is located at 283-285 Rivet St, New Bedford, MA 02744 and is currently priced at $269,608, approximately $99 per square foot. 283-285 Rivet St is a home located in Bristol County with nearby schools including John B. DeValles Elementary School, Roosevelt Middle School, and New Bedford High School.
Ownership History
Date
Name
Owned For
Owner Type
Purchase Details
Closed on
Aug 26, 2013
Sold by
Main Street Rt and Hernandez
Bought by
Browne Jonathan L
Current Estimated Value
Purchase Details
Closed on
Jul 26, 2011
Sold by
Hodge George and Bayou Villars Holding
Bought by
Main Street Rt and Hernandez
Home Financials for this Owner
Home Financials are based on the most recent Mortgage that was taken out on this home.
Original Mortgage
$140,000
Interest Rate
4.62%
Mortgage Type
Commercial
Purchase Details
Closed on
Mar 9, 2007
Sold by
Hinman Cyd F and Hinman Stewart M
Bought by
Leger Rt
Purchase Details
Closed on
Jun 14, 2002
Sold by
Pedra Maria V
Bought by
Hinman Stewart M and Hinman Cyd F
Create a Home Valuation Report for This Property
The Home Valuation Report is an in-depth analysis detailing your home's value as well as a comparison with similar homes in the area
Home Values in the Area
Average Home Value in this Area
Purchase History
| Date | Buyer | Sale Price | Title Company |
|---|---|---|---|
| Browne Jonathan L | $133,000 | -- | |
| Browne Jonathan L | $133,000 | -- | |
| Main Street Rt | $150,000 | -- | |
| Main Street Rt | $150,000 | -- | |
| Leger Rt | $100,000 | -- | |
| Leger Rt | $100,000 | -- | |
| Hinman Stewart M | $158,000 | -- | |
| Hinman Stewart M | $158,000 | -- |
Source: Public Records
Mortgage History
| Date | Status | Borrower | Loan Amount |
|---|---|---|---|
| Previous Owner | Main Street Rt | $140,000 | |
| Previous Owner | Hinman Stewart M | $1,800,000 | |
| Previous Owner | Hinman Stewart M | $175,000 |
Source: Public Records
Tax History Compared to Growth
Tax History
| Year | Tax Paid | Tax Assessment Tax Assessment Total Assessment is a certain percentage of the fair market value that is determined by local assessors to be the total taxable value of land and additions on the property. | Land | Improvement |
|---|---|---|---|---|
| 2025 | -- | $383,900 | $86,300 | $297,600 |
| 2024 | -- | $365,400 | $86,300 | $279,100 |
| 2023 | $0 | $328,500 | $71,900 | $256,600 |
| 2022 | $0 | $271,900 | $68,300 | $203,600 |
| 2021 | $0 | $235,400 | $64,700 | $170,700 |
| 2020 | $5,933 | $230,300 | $64,700 | $165,600 |
| 2019 | $5,792 | $236,600 | $64,700 | $171,900 |
| 2018 | $0 | $227,700 | $64,700 | $163,000 |
| 2017 | -- | $225,900 | $62,900 | $163,000 |
| 2016 | -- | $229,000 | $62,900 | $166,100 |
| 2015 | -- | $229,000 | $62,900 | $166,100 |
| 2014 | -- | $239,700 | $64,700 | $175,000 |
Source: Public Records
Map
Nearby Homes
- 283 Rivet St Unit 2
- 283 Rivet St Unit 1
- 283 Rivet St Unit 285
- 287 Rivet St
- Lot 287 Rivet St
- 279 Rivet St
- 291 Rivet St Unit 293
- 273 Rivet St Unit 275
- 198 Bonney St
- 198 Bonney St Unit 2
- 198 Bonney St Unit 1
- 194 Bonney St
- 190 Bonney St
- 79 Crapo St
- 201-203 Bonney St
- 201 Bonney St Unit 203
- 0 (WS) Crapo St
- 199 Bonney St
- 186 Bonney St
- 195 Bonney St