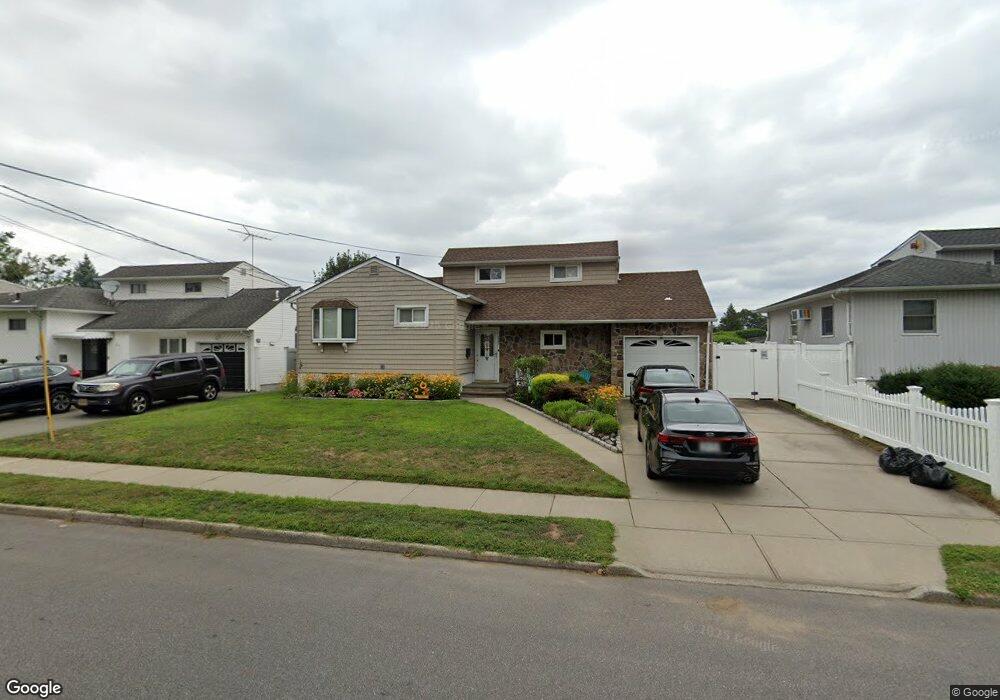
283 2nd Ave Massapequa Park, NY 11762
Estimated Value: $818,000 - $842,980
4
Beds
2
Baths
1,294
Sq Ft
$642/Sq Ft
Est. Value
About This Home
This home is located at 283 2nd Ave, Massapequa Park, NY 11762 and is currently estimated at $830,490, approximately $641 per square foot. 283 2nd Ave is a home located in Nassau County with nearby schools including Massapequa High School - Ames Campus, Berner Middle School, and Massapequa High School.
Ownership History
Date
Name
Owned For
Owner Type
Purchase Details
Closed on
Jun 22, 2015
Sold by
Blue Matrix Properties Llc
Bought by
Busch Lori R and Busch William E
Current Estimated Value
Home Financials for this Owner
Home Financials are based on the most recent Mortgage that was taken out on this home.
Original Mortgage
$408,000
Outstanding Balance
$316,907
Interest Rate
3.83%
Mortgage Type
New Conventional
Estimated Equity
$513,583
Purchase Details
Closed on
Oct 23, 2014
Sold by
Montgomery Marcella and Schelz Mark
Bought by
Blue Matrix Properties Llc
Purchase Details
Closed on
Jun 1, 1999
Sold by
Schelz Joseph C
Bought by
Montgomery Marcella and Schelz Mark
Home Financials for this Owner
Home Financials are based on the most recent Mortgage that was taken out on this home.
Original Mortgage
$50,000
Interest Rate
6.9%
Mortgage Type
Seller Take Back
Create a Home Valuation Report for This Property
The Home Valuation Report is an in-depth analysis detailing your home's value as well as a comparison with similar homes in the area
Home Values in the Area
Average Home Value in this Area
Purchase History
| Date | Buyer | Sale Price | Title Company |
|---|---|---|---|
| Busch Lori R | $480,000 | None Available | |
| Blue Matrix Properties Llc | $330,000 | First American Title | |
| Montgomery Marcella | $120,000 | First American Title Ins Co |
Source: Public Records
Mortgage History
| Date | Status | Borrower | Loan Amount |
|---|---|---|---|
| Open | Busch Lori R | $408,000 | |
| Previous Owner | Montgomery Marcella | $50,000 |
Source: Public Records
Tax History Compared to Growth
Tax History
| Year | Tax Paid | Tax Assessment Tax Assessment Total Assessment is a certain percentage of the fair market value that is determined by local assessors to be the total taxable value of land and additions on the property. | Land | Improvement |
|---|---|---|---|---|
| 2025 | $14,624 | $546 | $203 | $343 |
| 2024 | $3,896 | $546 | $203 | $343 |
| 2023 | $14,854 | $546 | $203 | $343 |
| 2022 | $14,854 | $546 | $203 | $343 |
| 2021 | $15,201 | $527 | $196 | $331 |
| 2020 | $15,718 | $966 | $672 | $294 |
| 2019 | $15,989 | $966 | $672 | $294 |
| 2018 | $14,781 | $902 | $0 | $0 |
| 2017 | $8,753 | $902 | $672 | $230 |
| 2016 | $12,200 | $902 | $672 | $230 |
| 2015 | -- | $902 | $672 | $230 |
| 2014 | -- | $902 | $672 | $230 |
| 2013 | $2,849 | $902 | $672 | $230 |
Source: Public Records
Map
Nearby Homes
- 251 Roosevelt Ave
- 204 Broadway
- 201 Cypress St
- 208 Oak St
- 366 Broadway
- 312 Ocean Ave
- 395 Pacific St
- 229 Philadelphia Ave
- 332 Eastlake Ave
- 170 Lindbergh St
- 118 Broadway
- 168 von Huenfeld St
- 179 Park Ln
- 1130 Lakeshore Dr
- 52 Westwood Rd S
- 94 Charles Ave
- 117 Ocean Ave
- 384 Connecticut Ave
- 97 Pacific St
- 89 3rd Ave