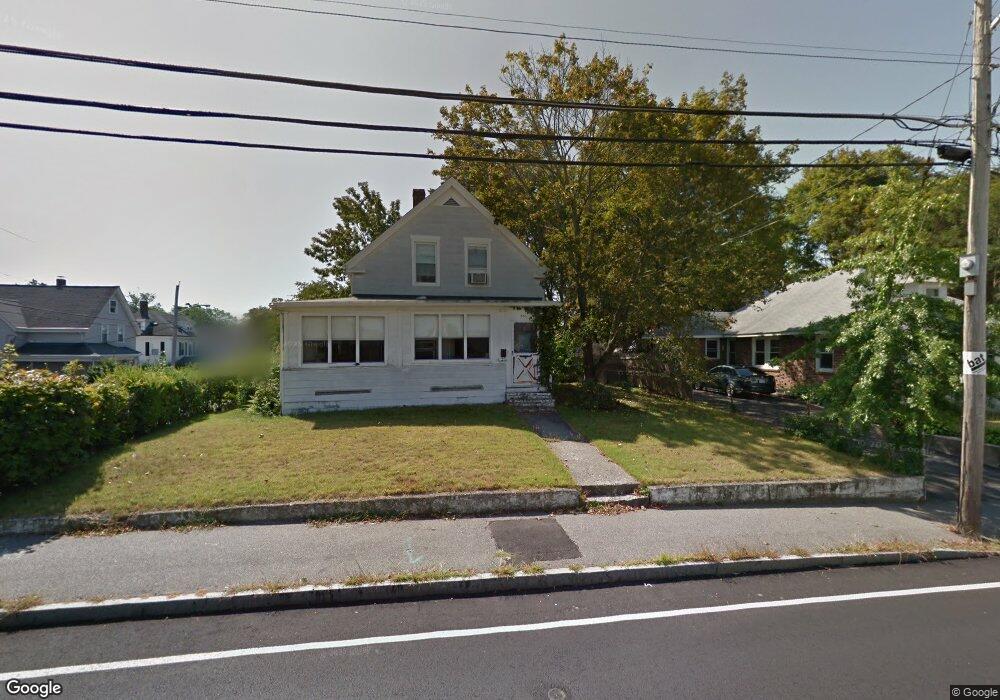
283 Court St Brockton, MA 02302
Estimated Value: $396,000 - $439,531
3
Beds
1
Bath
1,085
Sq Ft
$379/Sq Ft
Est. Value
About This Home
This home is located at 283 Court St, Brockton, MA 02302 and is currently estimated at $411,383, approximately $379 per square foot. 283 Court St is a home located in Plymouth County with nearby schools including Arnone Elementary School, Joseph F. Plouffe Middle School, and Brockton Area Seventh-Day Adventist Academy.
Ownership History
Date
Name
Owned For
Owner Type
Purchase Details
Closed on
Jan 10, 2013
Sold by
Bausemer Michael E and Bausemer Geraldine
Bought by
Bausemer Michael E and Bausemer Geraldine
Current Estimated Value
Purchase Details
Closed on
Oct 24, 2005
Sold by
Mccarthy Marie A
Bought by
Bausemer Michael E and Bausemer Geraldine
Home Financials for this Owner
Home Financials are based on the most recent Mortgage that was taken out on this home.
Original Mortgage
$172,000
Interest Rate
5.72%
Mortgage Type
Purchase Money Mortgage
Create a Home Valuation Report for This Property
The Home Valuation Report is an in-depth analysis detailing your home's value as well as a comparison with similar homes in the area
Home Values in the Area
Average Home Value in this Area
Purchase History
| Date | Buyer | Sale Price | Title Company |
|---|---|---|---|
| Bausemer Michael E | -- | -- | |
| Bausemer Michael E | $215,000 | -- |
Source: Public Records
Mortgage History
| Date | Status | Borrower | Loan Amount |
|---|---|---|---|
| Previous Owner | Bausemer Michael E | $174,500 | |
| Previous Owner | Bausemer Michael E | $32,000 | |
| Previous Owner | Bausemer Michael E | $172,000 | |
| Previous Owner | Bausemer Michael E | $32,000 |
Source: Public Records
Tax History Compared to Growth
Tax History
| Year | Tax Paid | Tax Assessment Tax Assessment Total Assessment is a certain percentage of the fair market value that is determined by local assessors to be the total taxable value of land and additions on the property. | Land | Improvement |
|---|---|---|---|---|
| 2025 | $4,196 | $346,500 | $140,700 | $205,800 |
| 2024 | $4,096 | $340,800 | $140,700 | $200,100 |
| 2023 | $3,685 | $283,900 | $107,200 | $176,700 |
| 2022 | $3,716 | $266,000 | $97,500 | $168,500 |
| 2021 | $3,296 | $227,300 | $81,600 | $145,700 |
| 2020 | $3,019 | $199,300 | $75,800 | $123,500 |
| 2019 | $2,760 | $177,600 | $73,800 | $103,800 |
| 2018 | $2,730 | $170,000 | $73,800 | $96,200 |
| 2017 | $2,663 | $165,400 | $73,800 | $91,600 |
| 2016 | $2,463 | $141,900 | $71,700 | $70,200 |
| 2015 | $2,093 | $115,300 | $71,700 | $43,600 |
| 2014 | $2,225 | $122,700 | $71,700 | $51,000 |
Source: Public Records
Map
Nearby Homes