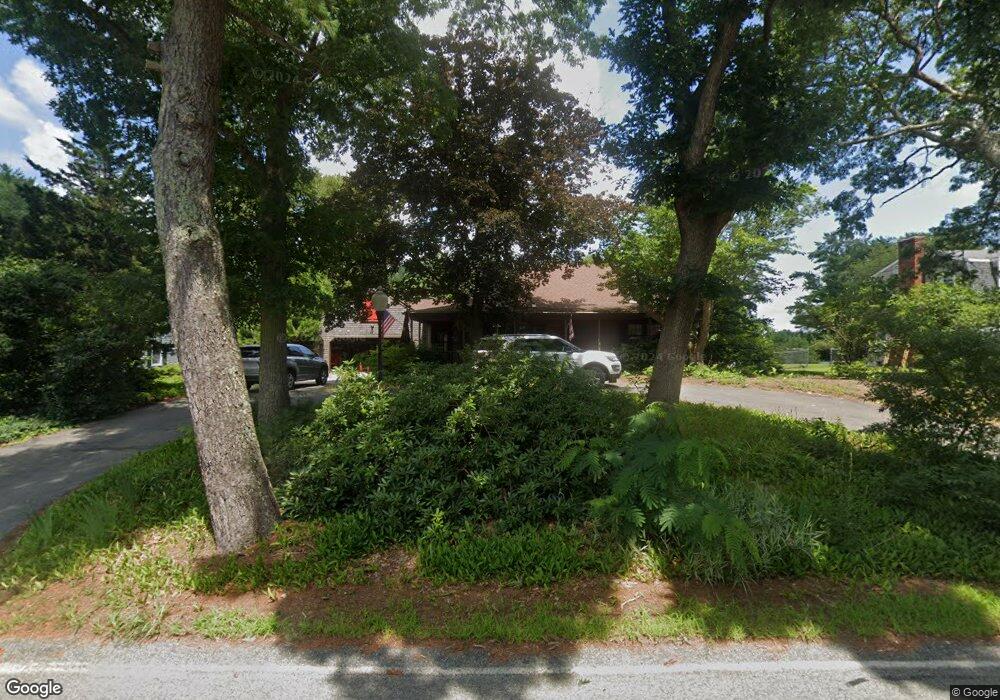
283 Hamlin St Acushnet, MA 02743
Upper Acushnet NeighborhoodEstimated Value: $564,000 - $590,000
Studio
2
Baths
2,512
Sq Ft
$229/Sq Ft
Est. Value
About This Home
This home is located at 283 Hamlin St, Acushnet, MA 02743 and is currently estimated at $575,387, approximately $229 per square foot. 283 Hamlin St is a home located in Bristol County with nearby schools including Acushnet Elementary School, Albert F Ford Middle School, and St Francis Xavier Elementary School.
Ownership History
Date
Name
Owned For
Owner Type
Purchase Details
Closed on
Mar 11, 2022
Sold by
Martin Georgette F
Bought by
Martin Robert A
Current Estimated Value
Purchase Details
Closed on
Feb 15, 2022
Sold by
Martin Georgette F
Bought by
Martin Robert A and Martin Georgette M
Create a Home Valuation Report for This Property
The Home Valuation Report is an in-depth analysis detailing your home's value as well as a comparison with similar homes in the area
Home Values in the Area
Average Home Value in this Area
Purchase History
| Date | Buyer | Sale Price | Title Company |
|---|---|---|---|
| Martin Robert A | -- | None Available | |
| Martin Robert A | -- | None Available |
Source: Public Records
Tax History
| Year | Tax Paid | Tax Assessment Tax Assessment Total Assessment is a certain percentage of the fair market value that is determined by local assessors to be the total taxable value of land and additions on the property. | Land | Improvement |
|---|---|---|---|---|
| 2025 | $56 | $516,600 | $155,500 | $361,100 |
| 2024 | $5,336 | $467,700 | $147,300 | $320,400 |
| 2023 | $5,395 | $449,600 | $133,600 | $316,000 |
| 2022 | $5,350 | $403,200 | $125,500 | $277,700 |
| 2021 | $4,990 | $360,800 | $125,500 | $235,300 |
| 2020 | $4,915 | $352,600 | $117,300 | $235,300 |
| 2019 | $4,679 | $330,000 | $111,800 | $218,200 |
| 2018 | $4,538 | $314,700 | $111,800 | $202,900 |
| 2017 | $4,417 | $305,900 | $111,800 | $194,100 |
| 2016 | $4,448 | $306,100 | $111,800 | $194,300 |
| 2015 | $4,098 | $287,000 | $111,800 | $175,200 |
Source: Public Records
Map
Nearby Homes
Your Personal Tour Guide
Ask me questions while you tour the home.