283 N 400 W Clearfield, UT 84015
Estimated Value: $358,000 - $413,000
3
Beds
1
Bath
1,517
Sq Ft
$252/Sq Ft
Est. Value
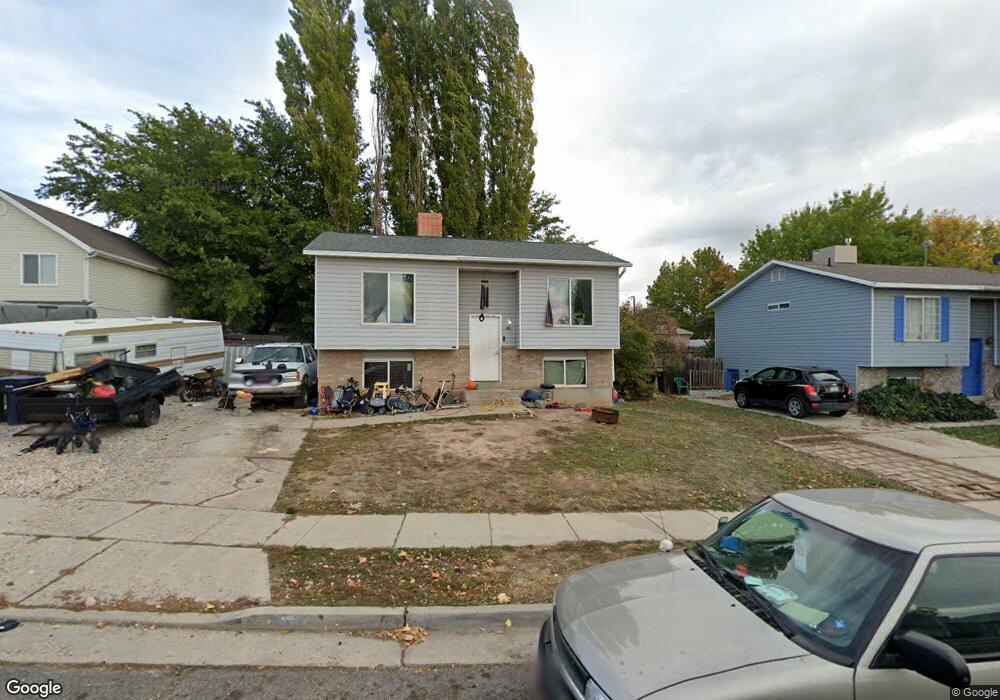
About This Home
This home is located at 283 N 400 W, Clearfield, UT 84015 and is currently estimated at $382,763, approximately $252 per square foot. 283 N 400 W is a home located in Davis County with nearby schools including Holt Elementary School, North Davis Junior High School, and Clearfield High School.
Ownership History
Date
Name
Owned For
Owner Type
Purchase Details
Closed on
Dec 7, 2010
Sold by
Dunn Benjamin M
Bought by
Dunn Benjamin M and Dunn Krystal A
Current Estimated Value
Home Financials for this Owner
Home Financials are based on the most recent Mortgage that was taken out on this home.
Original Mortgage
$4,720
Interest Rate
4.18%
Mortgage Type
Stand Alone Second
Purchase Details
Closed on
Sep 12, 2002
Sold by
Benson Nancy Kay
Bought by
Benson Nancy Kay
Home Financials for this Owner
Home Financials are based on the most recent Mortgage that was taken out on this home.
Original Mortgage
$64,000
Interest Rate
5.78%
Create a Home Valuation Report for This Property
The Home Valuation Report is an in-depth analysis detailing your home's value as well as a comparison with similar homes in the area
Home Values in the Area
Average Home Value in this Area
Purchase History
| Date | Buyer | Sale Price | Title Company |
|---|---|---|---|
| Dunn Benjamin M | -- | Equity Title Ins Agency Inc | |
| Benson Nancy Kay | -- | Bonneville Title Company Inc |
Source: Public Records
Mortgage History
| Date | Status | Borrower | Loan Amount |
|---|---|---|---|
| Closed | Dunn Benjamin M | $4,720 | |
| Closed | Dunn Benjamin M | $110,525 | |
| Closed | Benson Nancy Kay | $64,000 |
Source: Public Records
Tax History Compared to Growth
Tax History
| Year | Tax Paid | Tax Assessment Tax Assessment Total Assessment is a certain percentage of the fair market value that is determined by local assessors to be the total taxable value of land and additions on the property. | Land | Improvement |
|---|---|---|---|---|
| 2025 | $2,074 | $185,900 | $61,324 | $124,576 |
| 2024 | $1,998 | $180,400 | $58,701 | $121,699 |
| 2023 | $1,865 | $309,000 | $94,954 | $214,046 |
| 2022 | $1,927 | $172,700 | $55,382 | $117,318 |
| 2021 | $1,787 | $242,000 | $53,783 | $188,217 |
| 2020 | $1,547 | $208,000 | $44,338 | $163,662 |
| 2019 | $1,514 | $201,000 | $49,846 | $151,154 |
| 2018 | $1,361 | $176,000 | $44,243 | $131,757 |
| 2016 | $1,201 | $81,180 | $17,337 | $63,843 |
| 2015 | $1,146 | $73,865 | $17,337 | $56,528 |
| 2014 | $1,063 | $69,452 | $17,337 | $52,115 |
| 2013 | -- | $63,622 | $29,650 | $33,972 |
Source: Public Records
Map
Nearby Homes