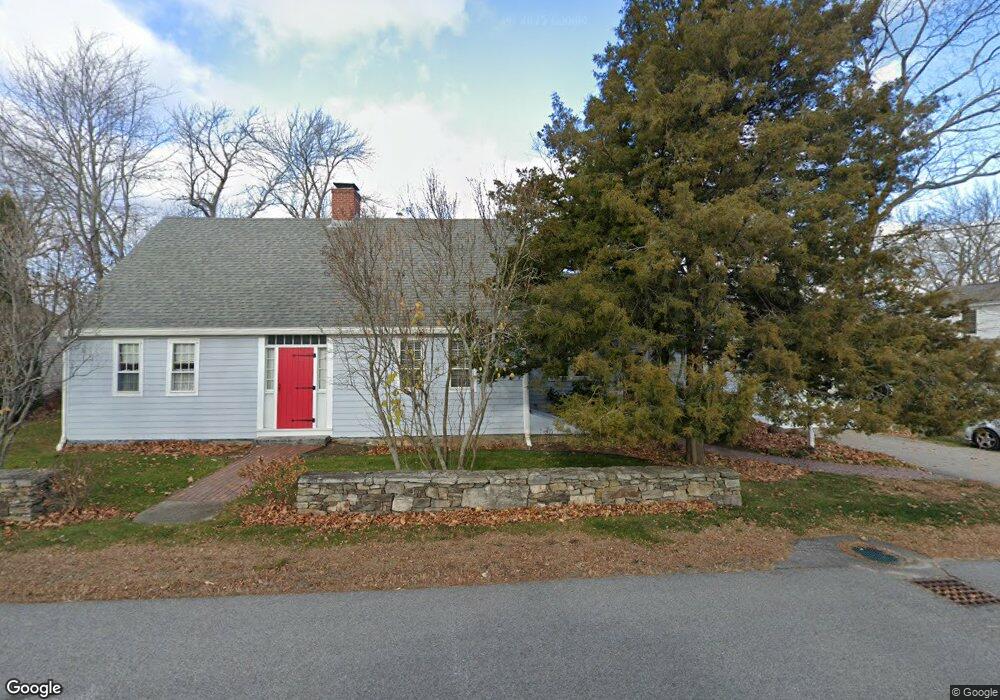
283 Pool St Biddeford, ME 04005
South Biddeford NeighborhoodEstimated Value: $578,329 - $843,000
2
Beds
2
Baths
2,178
Sq Ft
$312/Sq Ft
Est. Value
About This Home
This home is located at 283 Pool St, Biddeford, ME 04005 and is currently estimated at $680,332, approximately $312 per square foot. 283 Pool St is a home located in York County with nearby schools including John F Kennedy Memorial School, Biddeford Primary School, and Biddeford Intermediate School.
Ownership History
Date
Name
Owned For
Owner Type
Purchase Details
Closed on
Nov 20, 2023
Sold by
Russell Victoria E and Boyle Lawrence A
Bought by
Victoria E Russell Ret and Boyle
Current Estimated Value
Purchase Details
Closed on
Oct 9, 2009
Sold by
Eagle Dancer T and Eagle Boyle
Bought by
Boyle Lawrence A and Russell Victoria E
Home Financials for this Owner
Home Financials are based on the most recent Mortgage that was taken out on this home.
Original Mortgage
$379,000
Interest Rate
4.59%
Mortgage Type
Purchase Money Mortgage
Create a Home Valuation Report for This Property
The Home Valuation Report is an in-depth analysis detailing your home's value as well as a comparison with similar homes in the area
Home Values in the Area
Average Home Value in this Area
Purchase History
| Date | Buyer | Sale Price | Title Company |
|---|---|---|---|
| Victoria E Russell Ret | -- | None Available | |
| Boyle Lawrence A | -- | -- |
Source: Public Records
Mortgage History
| Date | Status | Borrower | Loan Amount |
|---|---|---|---|
| Previous Owner | Boyle Lawrence A | $379,000 |
Source: Public Records
Tax History
| Year | Tax Paid | Tax Assessment Tax Assessment Total Assessment is a certain percentage of the fair market value that is determined by local assessors to be the total taxable value of land and additions on the property. | Land | Improvement |
|---|---|---|---|---|
| 2024 | $5,692 | $400,300 | $168,800 | $231,500 |
| 2023 | $5,230 | $398,600 | $167,100 | $231,500 |
| 2022 | $6,190 | $377,200 | $184,700 | $192,500 |
| 2021 | $5,518 | $327,700 | $160,300 | $167,400 |
| 2020 | $5,774 | $312,500 | $149,500 | $163,000 |
| 2019 | $6,244 | $312,500 | $149,500 | $163,000 |
| 2018 | $6,156 | $312,500 | $149,500 | $163,000 |
| 2017 | $6,272 | $312,500 | $149,500 | $163,000 |
| 2016 | $6,206 | $312,500 | $149,500 | $163,000 |
| 2015 | $5,890 | $312,500 | $149,500 | $163,000 |
| 2014 | $5,744 | $312,500 | $149,500 | $163,000 |
| 2013 | -- | $323,500 | $168,300 | $155,200 |
Source: Public Records
Map
Nearby Homes