Estimated Value: $549,000 - $610,000
4
Beds
3
Baths
2,558
Sq Ft
$228/Sq Ft
Est. Value
About This Home
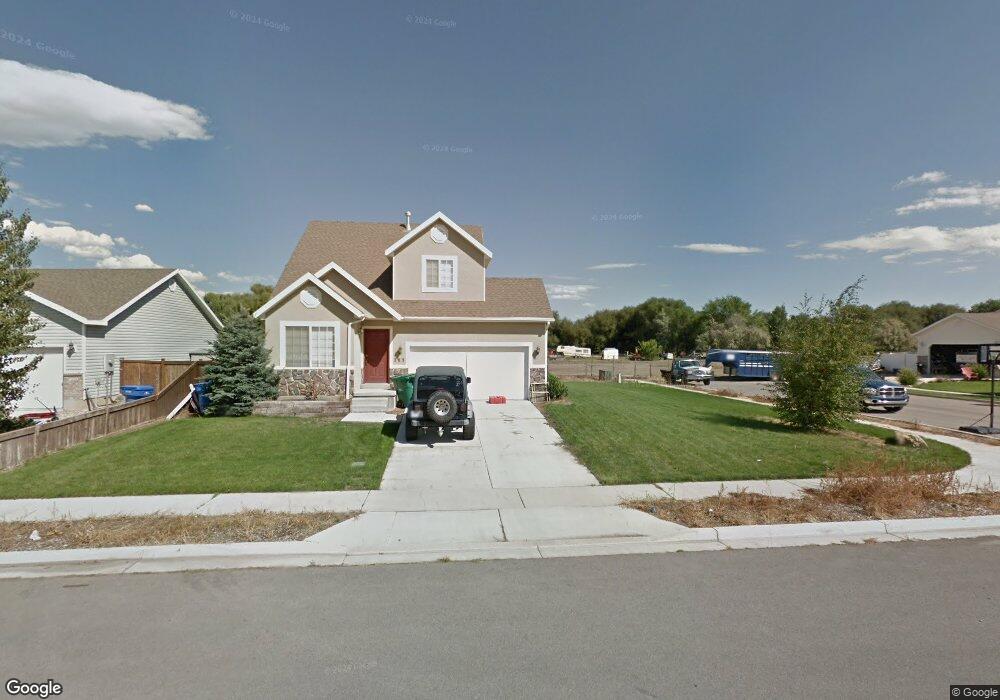
This home is located at 283 S 975 W, Lehi, UT 84043 and is currently estimated at $583,429, approximately $228 per square foot. 283 S 975 W is a home located in Utah County with nearby schools including Meadow Elementary School, Lehi Junior High School, and Lehi High School.
Ownership History
Date
Name
Owned For
Owner Type
Purchase Details
Closed on
Aug 17, 2011
Sold by
Federal Home Loan Mortgage Corporation
Bought by
Sharp Jefferson
Current Estimated Value
Home Financials for this Owner
Home Financials are based on the most recent Mortgage that was taken out on this home.
Original Mortgage
$170,563
Outstanding Balance
$116,319
Interest Rate
4.25%
Mortgage Type
FHA
Estimated Equity
$467,110
Purchase Details
Closed on
May 26, 2011
Sold by
Neal Nathan S and Neal Allicen
Bought by
Federal Home Loan Mortgage Corporation
Purchase Details
Closed on
Sep 14, 2001
Sold by
Hubble Homes Llc
Bought by
Neal Nathan S and Neal Allicen
Home Financials for this Owner
Home Financials are based on the most recent Mortgage that was taken out on this home.
Original Mortgage
$161,650
Interest Rate
7%
Create a Home Valuation Report for This Property
The Home Valuation Report is an in-depth analysis detailing your home's value as well as a comparison with similar homes in the area
Home Values in the Area
Average Home Value in this Area
Purchase History
| Date | Buyer | Sale Price | Title Company |
|---|---|---|---|
| Sharp Jefferson | -- | Bonneville Superior Title Co | |
| Federal Home Loan Mortgage Corporation | $161,916 | Etitle Insurance Agency | |
| Neal Nathan S | -- | First American Title Insuran |
Source: Public Records
Mortgage History
| Date | Status | Borrower | Loan Amount |
|---|---|---|---|
| Open | Sharp Jefferson | $170,563 | |
| Previous Owner | Neal Nathan S | $161,650 |
Source: Public Records
Tax History Compared to Growth
Tax History
| Year | Tax Paid | Tax Assessment Tax Assessment Total Assessment is a certain percentage of the fair market value that is determined by local assessors to be the total taxable value of land and additions on the property. | Land | Improvement |
|---|---|---|---|---|
| 2025 | $2,244 | $278,795 | $214,500 | $292,400 |
| 2024 | $2,244 | $262,625 | $0 | $0 |
| 2023 | $2,110 | $268,070 | $0 | $0 |
| 2022 | $2,177 | $268,125 | $0 | $0 |
| 2021 | $1,931 | $359,600 | $124,200 | $235,400 |
| 2020 | $1,820 | $335,000 | $115,000 | $220,000 |
| 2019 | $1,601 | $306,300 | $115,000 | $191,300 |
| 2018 | $1,609 | $291,000 | $99,700 | $191,300 |
| 2017 | $1,492 | $143,550 | $0 | $0 |
| 2016 | $1,471 | $131,285 | $0 | $0 |
| 2015 | $1,389 | $117,645 | $0 | $0 |
| 2014 | $1,249 | $105,215 | $0 | $0 |
Source: Public Records
Map
Nearby Homes
- 953 W 125 S
- 975 W 125 S
- 1012 W 425 S Unit 5
- 1012 W 425 S
- 1031 W 125 St S
- 1035 W Main St
- 1215 W 125 S
- 285 S 660 W
- 672 S 780 W
- 374 S 1330 West St
- 772 W 700 S
- 1356 W 425 S
- The Annie Plan at Longhorn Meadows
- The Kaitlyn Plan at Longhorn Meadows
- The Autumn Plan at Longhorn Meadows
- The Aurora Plan at Longhorn Meadows
- The Roosevelt Plan at Longhorn Meadows
- The Christine Plan at Longhorn Meadows
- The Brooke Plan at Longhorn Meadows
- The Madison Plan at Longhorn Meadows