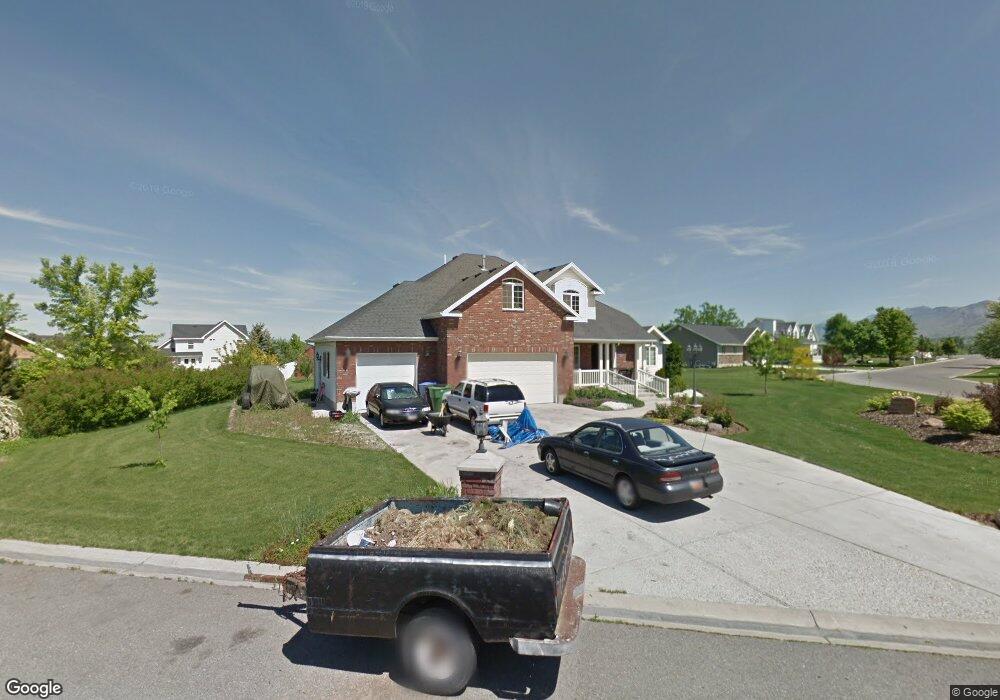
283 Schiess Ct Nibley, UT 84321
Estimated Value: $698,000 - $753,000
5
Beds
3
Baths
4,875
Sq Ft
$151/Sq Ft
Est. Value
About This Home
This home is located at 283 Schiess Ct, Nibley, UT 84321 and is currently estimated at $734,229, approximately $150 per square foot. 283 Schiess Ct is a home located in Cache County with nearby schools including Heritage School, Spring Creek Middle School, and South Cache Middle School.
Ownership History
Date
Name
Owned For
Owner Type
Purchase Details
Closed on
Oct 16, 2017
Sold by
Trippler Mark M and Trippler Monlea L
Bought by
Ricks Mark P and Ricks Cristin L
Current Estimated Value
Home Financials for this Owner
Home Financials are based on the most recent Mortgage that was taken out on this home.
Original Mortgage
$392,850
Outstanding Balance
$327,439
Interest Rate
3.83%
Mortgage Type
New Conventional
Estimated Equity
$406,790
Purchase Details
Closed on
Jul 5, 2005
Sold by
Nixon Jack
Bought by
Trippler Mark M and Trippler Monica L
Home Financials for this Owner
Home Financials are based on the most recent Mortgage that was taken out on this home.
Original Mortgage
$220,800
Interest Rate
5.55%
Mortgage Type
Future Advance Clause Open End Mortgage
Create a Home Valuation Report for This Property
The Home Valuation Report is an in-depth analysis detailing your home's value as well as a comparison with similar homes in the area
Home Values in the Area
Average Home Value in this Area
Purchase History
| Date | Buyer | Sale Price | Title Company |
|---|---|---|---|
| Ricks Mark P | -- | -- | |
| Trippler Mark M | -- | Northern Title Company |
Source: Public Records
Mortgage History
| Date | Status | Borrower | Loan Amount |
|---|---|---|---|
| Open | Ricks Mark P | $392,850 | |
| Previous Owner | Trippler Mark M | $220,800 |
Source: Public Records
Tax History Compared to Growth
Tax History
| Year | Tax Paid | Tax Assessment Tax Assessment Total Assessment is a certain percentage of the fair market value that is determined by local assessors to be the total taxable value of land and additions on the property. | Land | Improvement |
|---|---|---|---|---|
| 2025 | $2,895 | $383,790 | $0 | $0 |
| 2024 | $3,090 | $384,585 | $0 | $0 |
| 2023 | $3,243 | $377,880 | $0 | $0 |
| 2022 | $3,375 | $377,875 | $0 | $0 |
| 2021 | $3,245 | $564,200 | $72,800 | $491,400 |
| 2020 | $2,778 | $459,890 | $72,800 | $387,090 |
| 2019 | $2,914 | $459,890 | $72,800 | $387,090 |
| 2018 | $2,556 | $393,600 | $57,000 | $336,600 |
| 2017 | $2,448 | $199,650 | $0 | $0 |
| 2016 | $2,475 | $199,650 | $0 | $0 |
| 2015 | $2,282 | $185,280 | $0 | $0 |
| 2014 | $2,230 | $185,280 | $0 | $0 |
| 2013 | -- | $184,730 | $0 | $0 |
Source: Public Records
Map
Nearby Homes
- 396 W 3650 S
- 187 W 3175 S
- 189 W 3175 S
- 173 W 3175 S
- 3400 S 250 W Unit 2
- 262 W 3400 S Unit 11
- 324 W 3400 S Unit 7
- 278 W 3400 S Unit 10
- 294 W 3400 S Unit 9
- 308 W 3400 S Unit 8
- 338 W 3400 S Unit 6
- 268 W 3400 S Unit 5
- 191 W 3175 S Unit U629
- 191 W 3175 S
- 185 W 3175 S
- 186 W 3175 S
- 182 W 3175 S
- 3883 S 250 E
- 4009 S Cottonwoods Ct
- 3262 S 470 W
- 285 Schiess Ct
- 285 W 3850 S
- 275 Schiess Ct Unit 29
- 287 Schiess Ct Unit 26
- 3831 S 260 W
- 3744 Sheridan Ridge Ln
- 3854 S 260 W
- 3728 S 300 W
- 3861 S 280 W
- 295 Schiess Ct Unit 27
- 3760 S 300 W
- 3856 S 260 W
- 246 Quarter Cir
- 3803 S 250 W
- 3714 S 300 W
- 3776 S 300 W
- 247 Hillside Dr
- 247 Hillside Dr
- 275 Meadow View Ln
- 3719 S 300 W