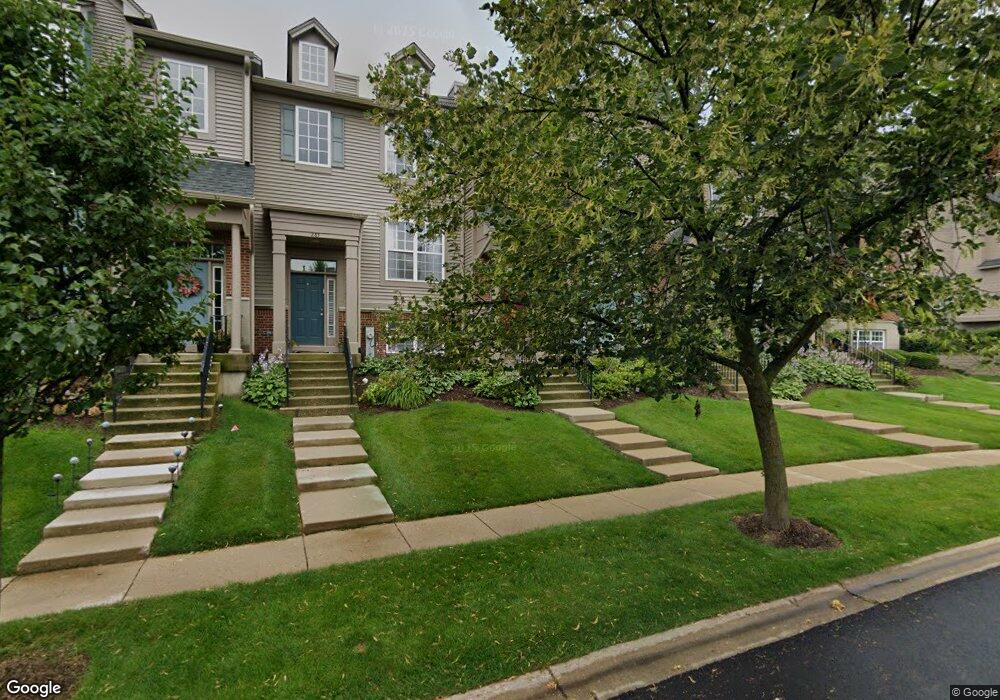
283 Station Park Cir Unit A Grayslake, IL 60030
Estimated Value: $275,837 - $310,000
2
Beds
3
Baths
1,471
Sq Ft
$198/Sq Ft
Est. Value
About This Home
This home is located at 283 Station Park Cir Unit A, Grayslake, IL 60030 and is currently estimated at $291,709, approximately $198 per square foot. 283 Station Park Cir Unit A is a home located in Lake County with nearby schools including Prairieview School, Frederick School, and Grayslake Middle School.
Ownership History
Date
Name
Owned For
Owner Type
Purchase Details
Closed on
Mar 1, 2024
Sold by
Little Deanna
Bought by
Latz Zachary
Current Estimated Value
Purchase Details
Closed on
Apr 26, 2021
Sold by
Midland Ira Inc
Bought by
Little Deanna
Purchase Details
Closed on
Sep 6, 2016
Sold by
Mitchell Ryan S and Michell Larissa V
Bought by
Midland Ira Inc
Purchase Details
Closed on
Jul 6, 2007
Sold by
Walsh Kevin
Bought by
Mitchell Ryan S
Home Financials for this Owner
Home Financials are based on the most recent Mortgage that was taken out on this home.
Original Mortgage
$192,500
Interest Rate
6.76%
Mortgage Type
Unknown
Purchase Details
Closed on
Aug 30, 2004
Sold by
Village Station Grayslake Llc
Bought by
Walsh Kevin
Home Financials for this Owner
Home Financials are based on the most recent Mortgage that was taken out on this home.
Original Mortgage
$159,250
Interest Rate
5.37%
Mortgage Type
Unknown
Create a Home Valuation Report for This Property
The Home Valuation Report is an in-depth analysis detailing your home's value as well as a comparison with similar homes in the area
Home Values in the Area
Average Home Value in this Area
Purchase History
| Date | Buyer | Sale Price | Title Company |
|---|---|---|---|
| Latz Zachary | $260,000 | Chicago Title | |
| Little Deanna | $185,000 | Chicago Title | |
| Midland Ira Inc | $145,000 | Proper Title Llc | |
| Mitchell Ryan S | $195,000 | Ticor Title Insurance Co | |
| Walsh Kevin | $177,000 | Chicago Title |
Source: Public Records
Mortgage History
| Date | Status | Borrower | Loan Amount |
|---|---|---|---|
| Previous Owner | Mitchell Ryan S | $192,500 | |
| Previous Owner | Walsh Kevin | $159,250 |
Source: Public Records
Tax History Compared to Growth
Tax History
| Year | Tax Paid | Tax Assessment Tax Assessment Total Assessment is a certain percentage of the fair market value that is determined by local assessors to be the total taxable value of land and additions on the property. | Land | Improvement |
|---|---|---|---|---|
| 2024 | $7,192 | $66,618 | $7,513 | $59,105 |
| 2023 | $6,960 | $61,140 | $6,895 | $54,245 |
| 2022 | $6,960 | $58,027 | $9,334 | $48,693 |
| 2021 | $6,898 | $55,774 | $8,972 | $46,802 |
| 2020 | $6,921 | $53,068 | $8,537 | $44,531 |
| 2019 | $6,696 | $50,915 | $8,191 | $42,724 |
| 2018 | $5,435 | $41,471 | $4,201 | $37,270 |
| 2017 | $5,460 | $39,010 | $3,952 | $35,058 |
| 2016 | $4,364 | $36,010 | $3,648 | $32,362 |
| 2015 | $4,205 | $32,898 | $3,333 | $29,565 |
| 2014 | $4,512 | $34,600 | $5,190 | $29,410 |
| 2012 | $4,482 | $36,135 | $5,420 | $30,715 |
Source: Public Records
Map
Nearby Homes
- 228 Station Park Cir
- 270 Lionel Dr
- 231 Lionel Dr
- 102 Soo Line Dr
- 533 Cannon Ball Dr
- 42 Village Station Ln
- Lot 48 Lake Ave
- 32100 Alleghany Rd
- 10 Glen St
- 349 Brittain Ave
- 34110 S Circle Dr
- 220 Bluff Ct
- 390 N Garfield Blvd
- 26155 W Il Route 120
- 121 Park Ave
- 146 Westerfield Place
- 101 Burton St
- 11 S Lake St
- 230 N Alleghany Rd
- 337 Woodland Dr Unit 6
- 283 Station Park Cir
- 283 Station Park Cir Unit 283
- 283 Station Park Cir Unit 28-3
- 279 Station Park Cir
- 279 Station Park Cir Unit 279
- 287 Station Park Cir
- 273 Station Park Cir
- 291 Station Park Cir
- 295 Station Park Cir Unit 295
- 269 Station Park Cir
- 265 Station Park Cir
- 301 Station Park Cir
- 261 Station Park Cir
- 305 Station Park Cir
- 257 Station Park Cir
- 309 Station Park Cir
- 258 Station Park Cir
- 254 Station Park Cir
- 313 Station Park Cir
- 324 Station Park Cir