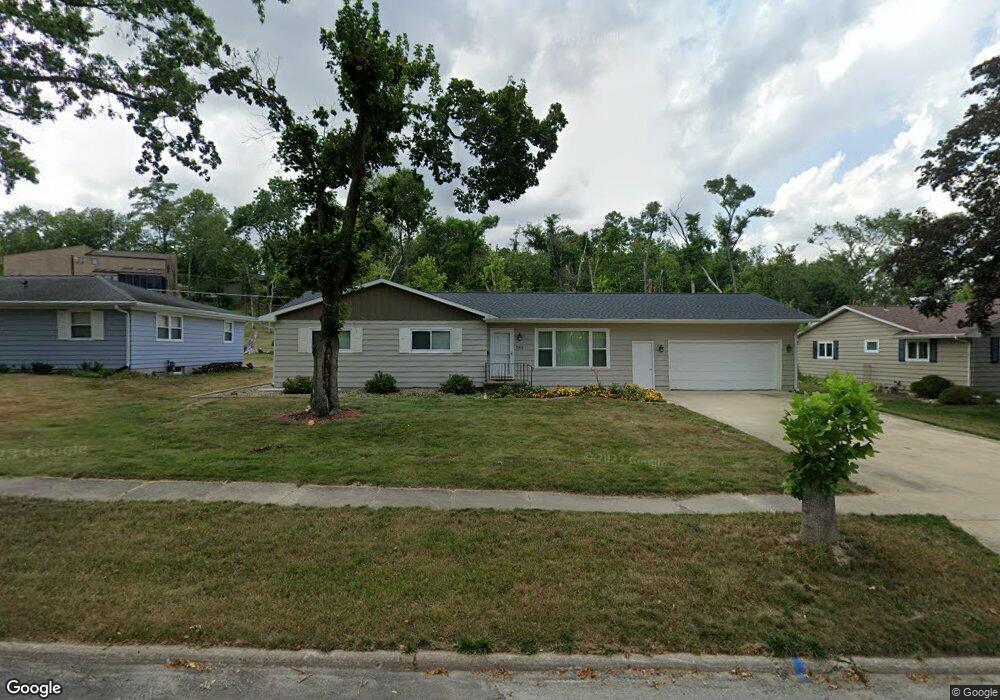
283 Tomahawk Trail SE Cedar Rapids, IA 52403
Estimated Value: $239,987 - $267,000
3
Beds
2
Baths
1,850
Sq Ft
$138/Sq Ft
Est. Value
About This Home
This home is located at 283 Tomahawk Trail SE, Cedar Rapids, IA 52403 and is currently estimated at $254,497, approximately $137 per square foot. 283 Tomahawk Trail SE is a home located in Linn County with nearby schools including Erskine Elementary School, McKinley STEAM Academy, and George Washington High School.
Ownership History
Date
Name
Owned For
Owner Type
Purchase Details
Closed on
Jan 31, 2020
Sold by
Knepper Eugene
Bought by
Knepper Kristin R
Current Estimated Value
Purchase Details
Closed on
Apr 13, 2006
Sold by
Weinstein Frank E
Bought by
Knepper Eugene A
Purchase Details
Closed on
Nov 29, 2004
Sold by
Contract Exchange Corp
Bought by
Weinstein Frank E
Home Financials for this Owner
Home Financials are based on the most recent Mortgage that was taken out on this home.
Original Mortgage
$100,000
Interest Rate
10%
Mortgage Type
Seller Take Back
Purchase Details
Closed on
Nov 12, 2004
Sold by
Contract Exchange Corp
Bought by
Knepper Eugene A
Home Financials for this Owner
Home Financials are based on the most recent Mortgage that was taken out on this home.
Original Mortgage
$100,000
Interest Rate
10%
Mortgage Type
Seller Take Back
Purchase Details
Closed on
Mar 18, 2004
Sold by
Jacobs Lanel and Jacobs Arnold
Bought by
Knepper Eugene A
Create a Home Valuation Report for This Property
The Home Valuation Report is an in-depth analysis detailing your home's value as well as a comparison with similar homes in the area
Purchase History
We collect this data history from publicly available records. To have your information removed, we recommend requesting removal directly through your county’s website.
| Date | Buyer | Sale Price | Title Company |
|---|---|---|---|
| Knepper Kristin R | $175,000 | None Available | |
| Knepper Eugene A | $99,500 | None Available | |
| Weinstein Frank E | -- | -- | |
| Knepper Eugene A | $100,000 | -- | |
| Contract Exchange Corp | $96,000 | -- | |
| Knepper Eugene A | -- | -- |
Source: Public Records
Mortgage History
We collect this data history from publicly available records. To have your information removed, we recommend requesting removal directly through your county’s website.
| Date | Status | Borrower | Loan Amount |
|---|---|---|---|
| Previous Owner | Knepper Eugene A | $100,000 |
Source: Public Records
Tax History
| Year | Tax Paid | Tax Assessment Tax Assessment Total Assessment is a certain percentage of the fair market value that is determined by local assessors to be the total taxable value of land and additions on the property. | Land | Improvement |
|---|---|---|---|---|
| 2025 | $3,962 | $237,300 | $52,400 | $184,900 |
| 2024 | $4,218 | $234,000 | $52,400 | $181,600 |
| 2023 | $4,218 | $223,900 | $52,400 | $171,500 |
| 2022 | $421,800 | $200,000 | $41,000 | $159,000 |
| 2021 | $3,220 | $155,400 | $41,000 | $114,400 |
| 2020 | $3,078 | $139,500 | $36,500 | $103,000 |
| 2019 | $2,018 | $129,300 | $36,500 | $92,800 |
| 2018 | $1,790 | $129,300 | $36,500 | $92,800 |
| 2017 | $2,589 | $127,100 | $36,500 | $90,600 |
| 2016 | $2,589 | $125,100 | $36,500 | $88,600 |
| 2015 | $2,803 | $135,038 | $36,456 | $98,582 |
| 2014 | $2,104 | $134,170 | $36,456 | $97,714 |
| 2013 | $2,024 | $134,170 | $36,456 | $97,714 |
Source: Public Records
Map
Nearby Homes
- 3634 Honey Hill Dr SE
- 284 Indiandale Rd SE
- 265 Lamplite Ln SE
- 142 Red Fox Rd SE
- 275 34th St SE
- 237 34th St SE
- 320 Eastland Dr SE
- 425 Red Fox Rd SE
- 2214 Kestrel Dr SE
- 2403 Kestrel Dr SE
- 2226 Kestrel Dr SE
- 3112 Peregrine Ct SE
- 2306 Kestrel Dr SE
- 2420 Kestrel Dr SE
- 2409 Kestrel Dr SE
- 2421 Kestrel Dr SE
- 2416 Kestrel Dr SE
- 2221 Kestrel Dr SE
- 2319 Kestrel Dr SE
- 2415 Kestrel Dr SE
- 287 Tomahawk Trail SE
- 279 Tomahawk Trail SE
- 275 Tomahawk Trail SE
- 291 Tomahawk Trail SE
- 286 Tomahawk Trail SE
- 278 Tomahawk Trail SE
- 290 Tomahawk Trail SE
- 276 Tomahawk Trail SE
- 271 Tomahawk Trail SE
- 295 Tomahawk Trail SE
- 3640 Honey Hill Dr SE
- 300 Tomahawk Trail SE
- 281 Thunderbird Rd SE
- 285 Thunderbird Rd SE
- 291 Thunderbird Rd SE
- 277 Thunderbird Rd SE
- 267 Tomahawk Trail SE
- 3649 Honey Hill Dr SE
- 3628 Honey Hill Dr SE
- 301 Thunderbird Rd SE
Your Personal Tour Guide
Ask me questions while you tour the home.