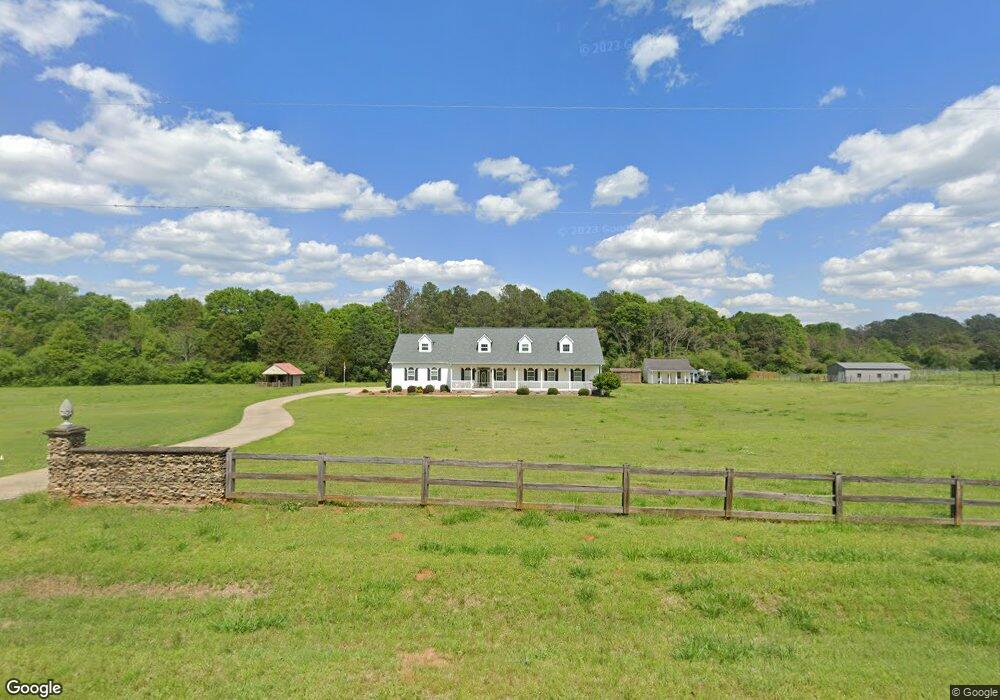
283 Trinity Rd Thomaston, GA 30286
Estimated Value: $381,000 - $581,000
4
Beds
5
Baths
3,048
Sq Ft
$161/Sq Ft
Est. Value
About This Home
This home is located at 283 Trinity Rd, Thomaston, GA 30286 and is currently estimated at $491,571, approximately $161 per square foot. 283 Trinity Rd is a home located in Upson County with nearby schools including Upson-Lee South Elementary School, Upson-Lee North Elementary School, and Upson-Lee Middle School.
Ownership History
Date
Name
Owned For
Owner Type
Purchase Details
Closed on
Apr 16, 2020
Sold by
Salter Adrienne Hewett
Bought by
Mcclain Adam Lee and Mcclain Kathryn
Current Estimated Value
Home Financials for this Owner
Home Financials are based on the most recent Mortgage that was taken out on this home.
Original Mortgage
$321,568
Interest Rate
3.2%
Mortgage Type
New Conventional
Purchase Details
Closed on
Apr 16, 2018
Sold by
Salter Adrienne Hewett
Bought by
Salter Adrienne Hewett and Salter Nicholas
Home Financials for this Owner
Home Financials are based on the most recent Mortgage that was taken out on this home.
Original Mortgage
$158,000
Interest Rate
4.44%
Mortgage Type
New Conventional
Purchase Details
Closed on
Jul 17, 2009
Sold by
Salter Bobby Joe
Bought by
Smith Andrew
Purchase Details
Closed on
May 18, 2005
Sold by
Boyt Gordon B
Bought by
Boyt Gordon B and Boyt Todd
Create a Home Valuation Report for This Property
The Home Valuation Report is an in-depth analysis detailing your home's value as well as a comparison with similar homes in the area
Home Values in the Area
Average Home Value in this Area
Purchase History
| Date | Buyer | Sale Price | Title Company |
|---|---|---|---|
| Mcclain Adam Lee | $315,000 | -- | |
| Salter Adrienne Hewett | -- | -- | |
| Salter Adrienne Hewett | -- | -- | |
| Smith Andrew | $58,056 | -- | |
| Boyt Gordon B | -- | -- |
Source: Public Records
Mortgage History
| Date | Status | Borrower | Loan Amount |
|---|---|---|---|
| Closed | Mcclain Adam Lee | $321,568 | |
| Previous Owner | Salter Adrienne Hewett | $158,000 |
Source: Public Records
Tax History Compared to Growth
Tax History
| Year | Tax Paid | Tax Assessment Tax Assessment Total Assessment is a certain percentage of the fair market value that is determined by local assessors to be the total taxable value of land and additions on the property. | Land | Improvement |
|---|---|---|---|---|
| 2024 | $4,408 | $172,337 | $16,504 | $155,833 |
| 2023 | $4,526 | $166,926 | $16,504 | $150,422 |
| 2022 | $3,794 | $136,812 | $8,994 | $127,818 |
| 2021 | $3,246 | $123,190 | $8,994 | $114,196 |
| 2020 | $2,795 | $101,068 | $7,752 | $93,316 |
| 2019 | $2,884 | $96,118 | $7,752 | $88,366 |
| 2018 | $2,698 | $90,005 | $7,752 | $82,253 |
| 2017 | $2,638 | $80,456 | $7,752 | $72,704 |
| 2016 | $2,579 | $77,461 | $6,460 | $71,001 |
| 2015 | $2,580 | $77,461 | $6,460 | $71,001 |
| 2014 | $2,558 | $76,718 | $5,664 | $71,054 |
Source: Public Records
Map
Nearby Homes
- 3682 Barnesville Hwy
- 0 Technology Pkwy Unit 30119
- 0 Technology Pkwy Unit 21917
- 0 Technology Pkwy Unit 30117
- 3006 Barnesville Hwy
- 1518 the Rock Rd
- 1031 the Rock Rd
- 1570 the Rock Rd
- 3487 Yatesville Hwy
- 2724 Barnesville St
- 2615 Barnesville Hwy
- Race Track Rd
- 216 E Moores Crossing Rd
- 508 Heath Dr
- 505 Heath Dr
- 98 Mud Bridge Rd
- 28 Mud Bridge Rd
- 0 Tyler Ln
- 524 Sunnyland Dr
- 657 Tom McKinley Rd
- 299 Trinity Rd
- 45 Trinity Rd
- 0 Trinity Rd Unit 7113942
- 3356 Barnesville Hwy
- 431 Trinity Rd
- 0 Johnston Rd Unit 8583327
- 3594 Barnesville Hwy
- 762 Johnston Rd
- 3291 Barnesville Hwy
- 522 Trinity Rd
- 3678 Barnesville Hwy
- 242 Rock Hill School Rd
- 3680 Barnesville Hwy
- 272 Rock Hill School Rd
- 3682 Barnesville St
- 3693 Barnesville Hwy
- 326 Trinity Rd
- 3684 Barnesville Hwy
- 144 Rock Hill School Rd Unit LOT 15
- 118 Rock Hill School Rd Unit LOT 13