Estimated Value: $556,231 - $745,000
4
Beds
2
Baths
2,012
Sq Ft
$316/Sq Ft
Est. Value
About This Home
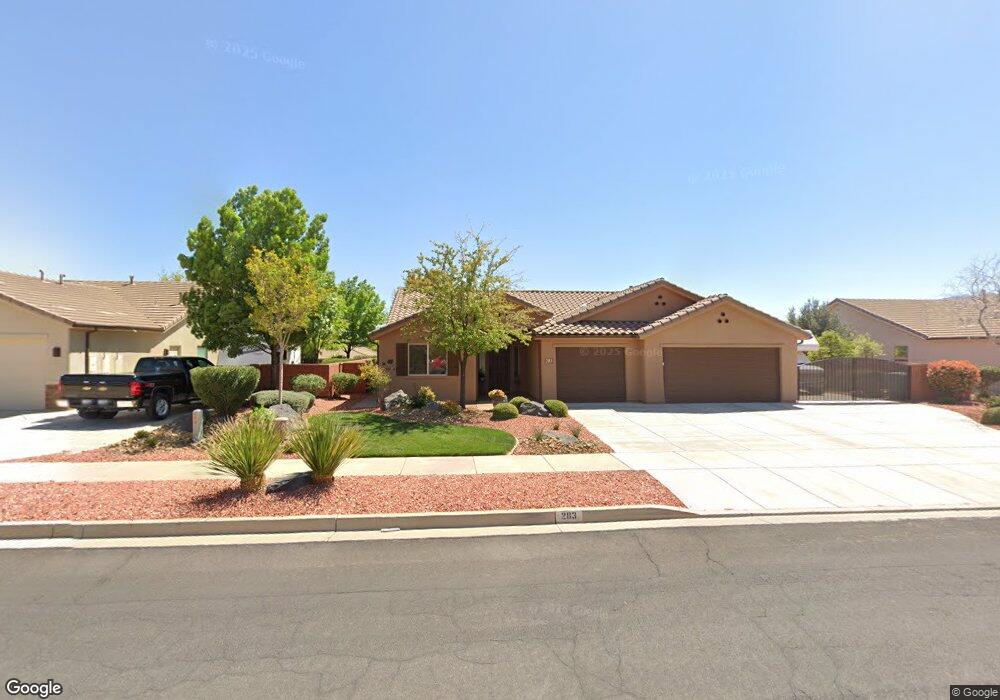
This home is located at 283 W 200 S, Ivins, UT 84738 and is currently estimated at $635,308, approximately $315 per square foot. 283 W 200 S is a home with nearby schools including Snow Canyon Middle School, Lava Ridge Intermediate School, and Snow Canyon High School.
Ownership History
Date
Name
Owned For
Owner Type
Purchase Details
Closed on
Aug 17, 2011
Sold by
Deschepper Robert and Deschepper Marilyn
Bought by
Deschepper Robert S and Deschepper Marilyn
Current Estimated Value
Purchase Details
Closed on
Feb 16, 2011
Sold by
Sun Crest Development Property Llc
Bought by
Deschepper Robert and Deschepper Marilyn
Home Financials for this Owner
Home Financials are based on the most recent Mortgage that was taken out on this home.
Original Mortgage
$371,338
Outstanding Balance
$362,122
Interest Rate
4.71%
Mortgage Type
Reverse Mortgage Home Equity Conversion Mortgage
Estimated Equity
$273,186
Create a Home Valuation Report for This Property
The Home Valuation Report is an in-depth analysis detailing your home's value as well as a comparison with similar homes in the area
Home Values in the Area
Average Home Value in this Area
Purchase History
| Date | Buyer | Sale Price | Title Company |
|---|---|---|---|
| Deschepper Robert S | -- | None Available | |
| Deschepper Robert | -- | Southern Utah Title |
Source: Public Records
Mortgage History
| Date | Status | Borrower | Loan Amount |
|---|---|---|---|
| Open | Deschepper Robert | $371,338 |
Source: Public Records
Tax History Compared to Growth
Tax History
| Year | Tax Paid | Tax Assessment Tax Assessment Total Assessment is a certain percentage of the fair market value that is determined by local assessors to be the total taxable value of land and additions on the property. | Land | Improvement |
|---|---|---|---|---|
| 2025 | $1,886 | $288,640 | $82,500 | $206,140 |
| 2023 | $1,947 | $285,340 | $60,500 | $224,840 |
| 2022 | $2,029 | $279,950 | $60,500 | $219,450 |
| 2021 | $1,957 | $401,100 | $80,000 | $321,100 |
| 2020 | $1,791 | $347,300 | $75,000 | $272,300 |
| 2019 | $1,824 | $345,900 | $60,000 | $285,900 |
| 2018 | $1,818 | $177,430 | $0 | $0 |
| 2017 | $1,727 | $164,010 | $0 | $0 |
| 2016 | $1,733 | $151,965 | $0 | $0 |
| 2015 | $1,750 | $147,730 | $0 | $0 |
| 2014 | $1,874 | $159,005 | $0 | $0 |
Source: Public Records
Map
Nearby Homes
- 262 W 200 S
- 257 S 230 W
- 148 S 200 W
- 336 W 270 S
- 492 S Memory Ln
- 249 S 100 W
- 704 W Desert Dove Ln
- 716 W Desert Dove Ln
- 692 W Desert Dove Ln
- 692 W Desert Dove Ln Unit (lot 3)
- 744 W Desert Dove Ln
- 744 W Desert Dove Ln Unit (lot 7)
- 140 W Center St Unit 20
- 464 W Big Horn Way
- 97 S 495 W
- 300 Main St
- 274 United Way
- 88 N Apex Ln
- 234 United Way
- 543 W 80 S