283 W 400 N Mount Pleasant, UT 84647
Estimated Value: $288,632 - $300,000
3
Beds
1
Bath
1,505
Sq Ft
$196/Sq Ft
Est. Value
About This Home
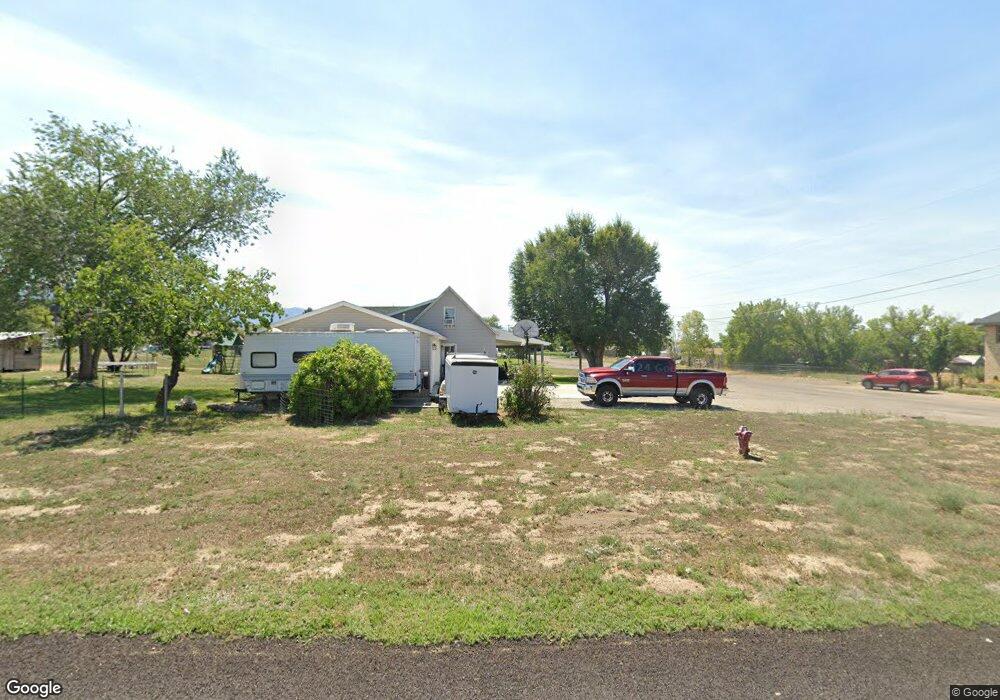
This home is located at 283 W 400 N, Mount Pleasant, UT 84647 and is currently estimated at $295,408, approximately $196 per square foot. 283 W 400 N is a home located in Sanpete County with nearby schools including North Sanpete High School and Wasatch Academy.
Ownership History
Date
Name
Owned For
Owner Type
Purchase Details
Closed on
Jun 9, 2016
Sold by
Kristen Fluckiger and Kristen John M
Bought by
Balderas Giovanni
Current Estimated Value
Purchase Details
Closed on
Nov 12, 2009
Sold by
Secretary Of Housing And Urban Developme
Bought by
Fluckiger Kristin and Fluckiger John Michael
Purchase Details
Closed on
Jun 15, 2009
Sold by
Bac Home Loans Servicing Lp
Bought by
Secretary Of Housing And Urban Developme
Purchase Details
Closed on
Dec 17, 2007
Sold by
Draney Jennifer H
Bought by
Draney Jennifer H and Draney Daryl L
Purchase Details
Closed on
Dec 29, 2005
Sold by
Draney Jennifer and Draney Daryl
Bought by
Draney Jennifer H
Create a Home Valuation Report for This Property
The Home Valuation Report is an in-depth analysis detailing your home's value as well as a comparison with similar homes in the area
Home Values in the Area
Average Home Value in this Area
Purchase History
| Date | Buyer | Sale Price | Title Company |
|---|---|---|---|
| Balderas Giovanni | -- | Backman Title Svcs | |
| Fluckiger Kristin | -- | -- | |
| Secretary Of Housing And Urban Developme | -- | -- | |
| Draney Jennifer H | -- | Central Utah Title | |
| Draney Jennifer H | -- | Central Utah Title |
Source: Public Records
Tax History Compared to Growth
Tax History
| Year | Tax Paid | Tax Assessment Tax Assessment Total Assessment is a certain percentage of the fair market value that is determined by local assessors to be the total taxable value of land and additions on the property. | Land | Improvement |
|---|---|---|---|---|
| 2024 | $1,239 | $131,957 | $0 | $0 |
| 2023 | $1,209 | $123,903 | $0 | $0 |
| 2022 | $1,210 | $110,628 | $0 | $0 |
| 2021 | $1,044 | $86,614 | $0 | $0 |
| 2020 | $984 | $74,387 | $0 | $0 |
| 2019 | $974 | $69,360 | $0 | $0 |
| 2018 | $894 | $109,661 | $31,455 | $78,206 |
| 2017 | $852 | $58,265 | $0 | $0 |
| 2016 | $761 | $52,094 | $0 | $0 |
| 2015 | $766 | $52,094 | $0 | $0 |
| 2014 | $782 | $52,094 | $0 | $0 |
| 2013 | $735 | $52,094 | $0 | $0 |
Source: Public Records
Map
Nearby Homes