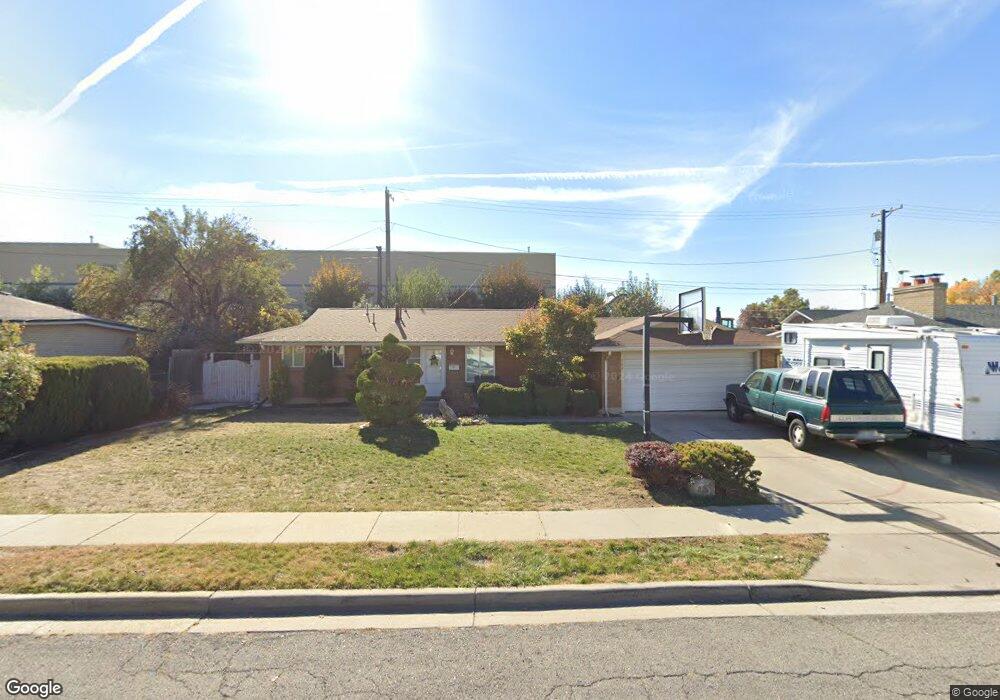
283 W 800 S Bountiful, UT 84010
Estimated Value: $480,000 - $529,902
4
Beds
3
Baths
2,306
Sq Ft
$218/Sq Ft
Est. Value
About This Home
This home is located at 283 W 800 S, Bountiful, UT 84010 and is currently estimated at $502,476, approximately $217 per square foot. 283 W 800 S is a home located in Davis County with nearby schools including Bountiful Elementary School, Millcreek Junior High School, and Bountiful High School.
Ownership History
Date
Name
Owned For
Owner Type
Purchase Details
Closed on
May 1, 2012
Sold by
Kondaur Capital Corporation
Bought by
Wuthrich Nathan R and Wuthrich Sandra A
Current Estimated Value
Home Financials for this Owner
Home Financials are based on the most recent Mortgage that was taken out on this home.
Original Mortgage
$170,525
Outstanding Balance
$118,172
Interest Rate
3.98%
Mortgage Type
New Conventional
Estimated Equity
$384,304
Purchase Details
Closed on
Feb 9, 2012
Sold by
Froget Anastasia and Froget Brian
Bought by
Kondaur Capital Corporation
Purchase Details
Closed on
Jun 8, 2005
Sold by
Nay Brent H and Nay Deena Marie
Bought by
Froget Brian and Froget Anastasia
Create a Home Valuation Report for This Property
The Home Valuation Report is an in-depth analysis detailing your home's value as well as a comparison with similar homes in the area
Purchase History
| Date | Buyer | Sale Price | Title Company |
|---|---|---|---|
| Wuthrich Nathan R | -- | Security Title Ins Ag | |
| Kondaur Capital Corporation | $165,000 | None Available | |
| Froget Brian | -- | Bonneville Title Company |
Source: Public Records
Mortgage History
| Date | Status | Borrower | Loan Amount |
|---|---|---|---|
| Open | Wuthrich Nathan R | $170,525 |
Source: Public Records
Tax History
| Year | Tax Paid | Tax Assessment Tax Assessment Total Assessment is a certain percentage of the fair market value that is determined by local assessors to be the total taxable value of land and additions on the property. | Land | Improvement |
|---|---|---|---|---|
| 2025 | $2,873 | $262,350 | $123,558 | $138,792 |
| 2024 | $2,763 | $262,350 | $107,919 | $154,431 |
| 2023 | $2,654 | $457,000 | $200,887 | $256,113 |
| 2022 | $2,818 | $266,750 | $110,330 | $156,420 |
| 2021 | $2,361 | $340,000 | $144,291 | $195,709 |
| 2020 | $2,091 | $302,000 | $124,015 | $177,985 |
| 2019 | $2,111 | $298,000 | $136,245 | $161,755 |
| 2018 | $1,953 | $271,000 | $133,676 | $137,324 |
| 2016 | $1,546 | $115,390 | $53,886 | $61,504 |
| 2015 | $1,507 | $106,095 | $53,886 | $52,209 |
| 2014 | $1,517 | $110,093 | $53,886 | $56,207 |
| 2013 | -- | $101,368 | $39,809 | $61,559 |
Source: Public Records
Map
Nearby Homes
Your Personal Tour Guide
Ask me questions while you tour the home.