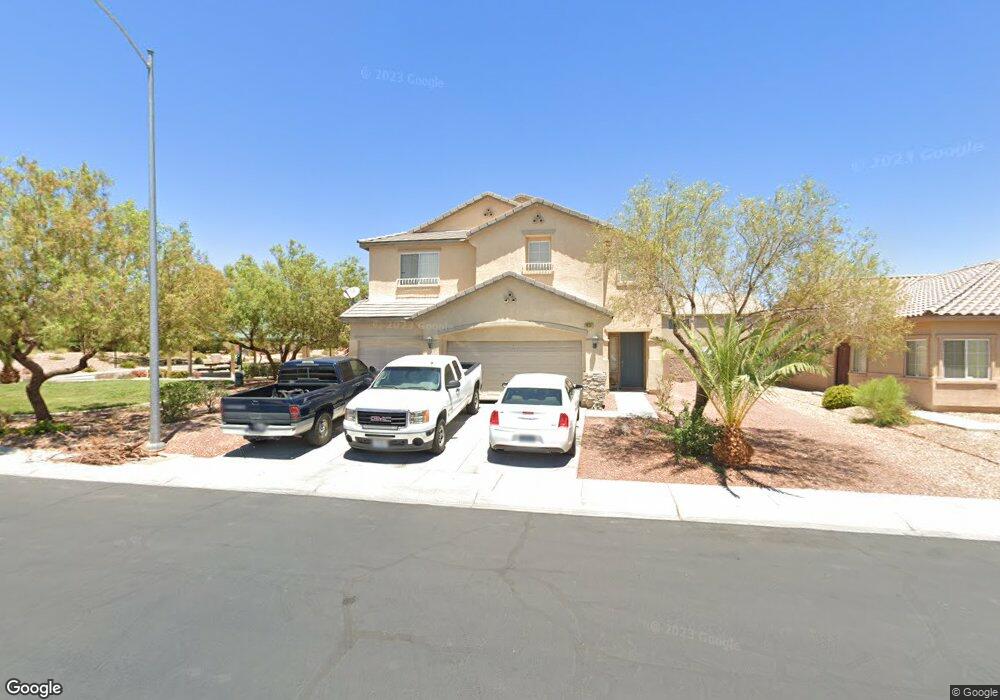
2830 Bridleton Ave North Las Vegas, NV 89081
Northridge NeighborhoodEstimated Value: $466,176 - $525,000
4
Beds
3
Baths
2,667
Sq Ft
$181/Sq Ft
Est. Value
About This Home
This home is located at 2830 Bridleton Ave, North Las Vegas, NV 89081 and is currently estimated at $483,044, approximately $181 per square foot. 2830 Bridleton Ave is a home located in Clark County with nearby schools including John Tartan Elementary School, Carroll M. Johnston STEM Academy of Environmental Studies, and Clifford O. Findlay Middle School.
Ownership History
Date
Name
Owned For
Owner Type
Purchase Details
Closed on
Sep 19, 2012
Sold by
Khuon Vicheartith
Bought by
Sfr Invesments Pool I Llc
Current Estimated Value
Purchase Details
Closed on
Jul 21, 2005
Sold by
Us Home Corp
Bought by
Khuon Vichearith
Home Financials for this Owner
Home Financials are based on the most recent Mortgage that was taken out on this home.
Original Mortgage
$276,150
Interest Rate
6.12%
Mortgage Type
Unknown
Purchase Details
Closed on
Jul 19, 2005
Sold by
Khuon Shahzan
Bought by
Khuon Vichearith
Home Financials for this Owner
Home Financials are based on the most recent Mortgage that was taken out on this home.
Original Mortgage
$276,150
Interest Rate
6.12%
Mortgage Type
Unknown
Purchase Details
Closed on
Apr 15, 2005
Sold by
Us Home Corp
Bought by
Us Home Corp
Create a Home Valuation Report for This Property
The Home Valuation Report is an in-depth analysis detailing your home's value as well as a comparison with similar homes in the area
Home Values in the Area
Average Home Value in this Area
Purchase History
| Date | Buyer | Sale Price | Title Company |
|---|---|---|---|
| Sfr Invesments Pool I Llc | $7,500 | None Available | |
| Khuon Vichearith | $345,205 | North American Title Co | |
| Khuon Vichearith | -- | North American Title Co | |
| Us Home Corp | -- | North American Title Co |
Source: Public Records
Mortgage History
| Date | Status | Borrower | Loan Amount |
|---|---|---|---|
| Previous Owner | Khuon Vichearith | $276,150 |
Source: Public Records
Tax History Compared to Growth
Tax History
| Year | Tax Paid | Tax Assessment Tax Assessment Total Assessment is a certain percentage of the fair market value that is determined by local assessors to be the total taxable value of land and additions on the property. | Land | Improvement |
|---|---|---|---|---|
| 2025 | $2,404 | $137,015 | $32,200 | $104,815 |
| 2024 | $2,227 | $137,015 | $32,200 | $104,815 |
| 2023 | $2,227 | $131,064 | $32,200 | $98,864 |
| 2022 | $2,062 | $114,890 | $24,850 | $90,040 |
| 2021 | $1,909 | $109,252 | $23,800 | $85,452 |
| 2020 | $1,770 | $106,596 | $22,050 | $84,546 |
| 2019 | $1,659 | $102,184 | $18,900 | $83,284 |
| 2018 | $1,583 | $90,487 | $15,050 | $75,437 |
| 2017 | $2,628 | $78,229 | $13,300 | $64,929 |
| 2016 | $1,482 | $69,084 | $10,850 | $58,234 |
| 2015 | $1,479 | $54,823 | $7,700 | $47,123 |
| 2014 | $1,433 | $41,324 | $5,600 | $35,724 |
Source: Public Records
Map
Nearby Homes
- 2916 Kildare Cove Ct
- 2771 Alderly Ridge Ave
- 2650 Dahlia Falls Ave
- 2650 Dahlia Falls Ave Unit 126
- 2646 Dahlia Falls Ave Unit 125
- 1865 Plan at Kalea Bay
- 1795 Plan at Kalea Bay
- 1715 Plan at Kalea Bay
- 6059 Orchid Falls St Unit 11
- 6063 Orchid Falls St
- 6063 Orchid Falls St Unit 12
- 6067 Orchid Falls St Unit 13
- 6071 Orchid Falls St Unit 14
- 6105 Orchid Falls St Unit 16
- 6109 Orchid Falls St Unit 17
- 6125 Orchid Falls St Unit 21
- 6133 Orchid Falls St Unit 23
- 2621 Torch Ave
- 3032 Prairie Princess Ave
- 3156 Mclennan Ave
- 2834 Bridleton Ave
- 2838 Bridleton Ave
- 2829 Kildare Cove Ct
- 2833 Kildare Cove Ct Unit 4
- 2842 Bridleton Ave
- 2837 Kildare Cove Ct
- 2829 Bridleton Ave
- 2825 Bridleton Ave
- 2833 Bridleton Ave
- 2841 Kildare Cove Ct
- 2821 Bridleton Ave
- 2821 Bridleton Ave
- 2821 Bridleton Ave
- 2904 Bridleton Ave
- 2837 Bridleton Ave
- 2817 Bridleton Ave
- 2905 Kildare Cove Ct
- 6064 Dover Dove Ct
- 6068 Dover Dove Ct
- 6060 Dover Dove Ct