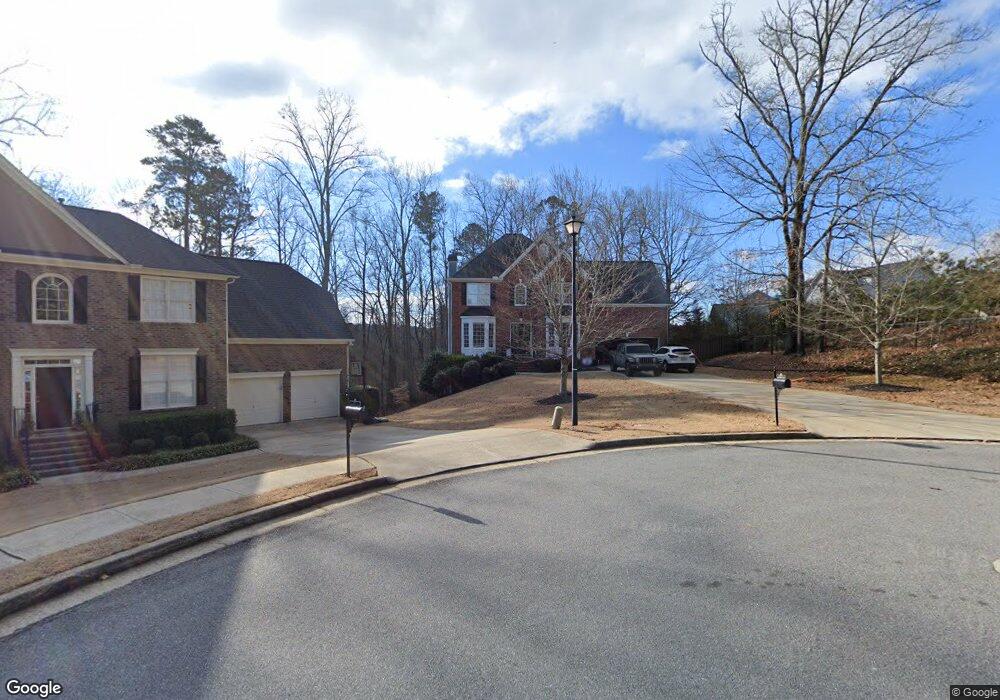
2830 Chadbourne Trail Alpharetta, GA 30004
Estimated Value: $635,000 - $724,000
4
Beds
4
Baths
2,636
Sq Ft
$256/Sq Ft
Est. Value
About This Home
This home is located at 2830 Chadbourne Trail, Alpharetta, GA 30004 and is currently estimated at $676,073, approximately $256 per square foot. 2830 Chadbourne Trail is a home located in Forsyth County with nearby schools including Brandywine Elementary School, DeSana Middle School, and Denmark High School.
Ownership History
Date
Name
Owned For
Owner Type
Purchase Details
Closed on
May 1, 2023
Sold by
Taylor Tom
Bought by
Taylor Thomas A and Taylor Angela A
Current Estimated Value
Home Financials for this Owner
Home Financials are based on the most recent Mortgage that was taken out on this home.
Original Mortgage
$473,137
Outstanding Balance
$459,812
Interest Rate
6.32%
Mortgage Type
FHA
Estimated Equity
$216,261
Purchase Details
Closed on
Aug 12, 2013
Sold by
Ohlmeyer Gina M
Bought by
Taylor Tom and Taylor Angela
Home Financials for this Owner
Home Financials are based on the most recent Mortgage that was taken out on this home.
Original Mortgage
$293,092
Interest Rate
4.25%
Mortgage Type
FHA
Purchase Details
Closed on
Sep 30, 2002
Sold by
D R Horton Inc Torrey
Bought by
Ohlmeyer Gina M
Home Financials for this Owner
Home Financials are based on the most recent Mortgage that was taken out on this home.
Original Mortgage
$150,000
Interest Rate
5%
Mortgage Type
New Conventional
Create a Home Valuation Report for This Property
The Home Valuation Report is an in-depth analysis detailing your home's value as well as a comparison with similar homes in the area
Home Values in the Area
Average Home Value in this Area
Purchase History
| Date | Buyer | Sale Price | Title Company |
|---|---|---|---|
| Taylor Thomas A | -- | None Listed On Document | |
| Taylor Tom | $298,500 | -- | |
| Ohlmeyer Gina M | $247,100 | -- |
Source: Public Records
Mortgage History
| Date | Status | Borrower | Loan Amount |
|---|---|---|---|
| Open | Taylor Thomas A | $473,137 | |
| Previous Owner | Taylor Tom | $293,092 | |
| Previous Owner | Ohlmeyer Gina M | $150,000 |
Source: Public Records
Tax History Compared to Growth
Tax History
| Year | Tax Paid | Tax Assessment Tax Assessment Total Assessment is a certain percentage of the fair market value that is determined by local assessors to be the total taxable value of land and additions on the property. | Land | Improvement |
|---|---|---|---|---|
| 2025 | $4,815 | $269,980 | $68,000 | $201,980 |
| 2024 | $4,815 | $246,228 | $68,000 | $178,228 |
| 2023 | $4,357 | $238,700 | $60,000 | $178,700 |
| 2022 | $4,321 | $161,444 | $40,000 | $121,444 |
| 2021 | $3,875 | $161,444 | $40,000 | $121,444 |
| 2020 | $3,740 | $154,880 | $40,000 | $114,880 |
| 2019 | $3,612 | $148,432 | $40,000 | $108,432 |
| 2018 | $3,554 | $144,544 | $32,000 | $112,544 |
| 2017 | $3,297 | $131,736 | $32,000 | $99,736 |
| 2016 | $3,128 | $123,736 | $24,000 | $99,736 |
| 2015 | $3,092 | $121,736 | $22,000 | $99,736 |
| 2014 | $2,677 | $109,132 | $0 | $0 |
Source: Public Records
Map
Nearby Homes
- 1130 Pennington View Ln
- 255 White Pines Dr
- 845 Miranda Terrace
- 1405 Overland Crossing
- 1060 Hargrove Point Way
- 1620 Woodall View Ct
- 550 Central Park Overlook
- 1245 Overland Crossing
- 1615 Waverly Glen Dr
- 840 Central Park Overlook
- 925 Hargrove Point Way
- 520 Walden Glen Ln
- 860 Hargrove Point Way
- 3692 Archgate Ct
- 472 Grayson Way
- 1293 Dalesford Dr
- 1040 Peyton View Ct
- 419 Grayson Way
- 2840 Chadbourne Trail
- 945 Pressing Dr
- 935 Pressing Dr
- 2850 Chadbourne Trail
- 940 Pressing Dr
- 2235 Grand Jct
- 2860 Chadbourne Trail
- 925 Pressing Dr
- 2865 Chadbourne Trail
- 2245 Grand Jct
- 930 Pressing Dr
- 2225 Grand Jct
- 2255 Grand Jct
- 910 Pressing Dr
- 2870 Chadbourne Trail
- 2215 Grand Jct
- 915 Pressing Dr
- 915 Pressing Dr
- 2875 Chadbourne Trail
- 880 Pressing Dr