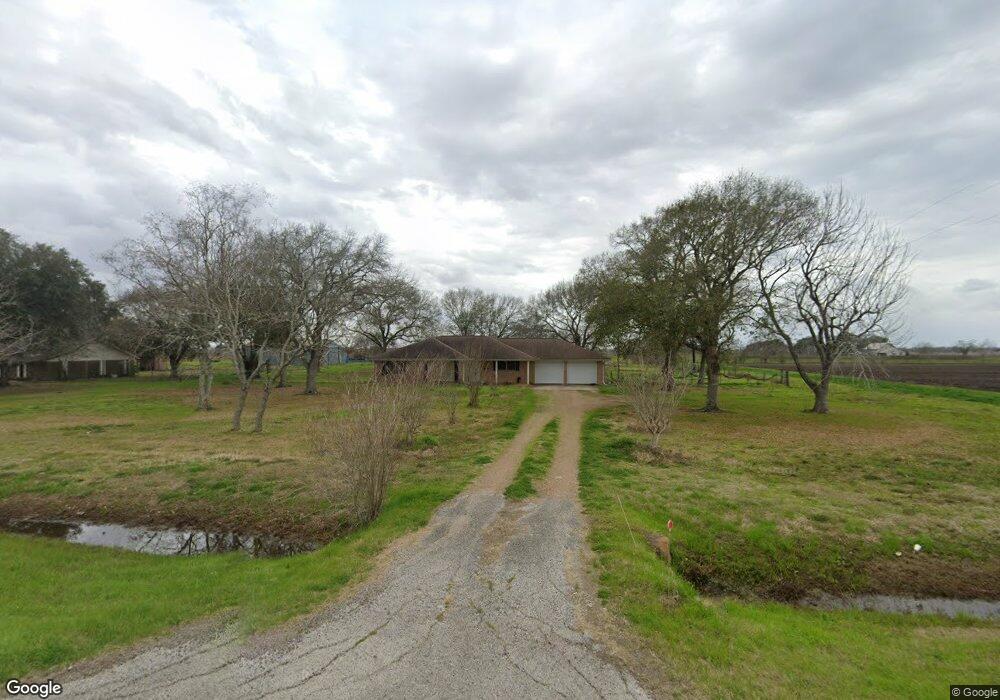
2830 Fm 360 Rd Rosenberg, TX 77471
Estimated Value: $338,000 - $416,145
3
Beds
2
Baths
1,680
Sq Ft
$235/Sq Ft
Est. Value
About This Home
This home is located at 2830 Fm 360 Rd, Rosenberg, TX 77471 and is currently estimated at $394,286, approximately $234 per square foot. 2830 Fm 360 Rd is a home located in Fort Bend County with nearby schools including Needville Elementary School, Needville Junior High School, and Needville Middle School.
Ownership History
Date
Name
Owned For
Owner Type
Purchase Details
Closed on
May 1, 2020
Sold by
Cook Brian Keith
Bought by
Smith Ashley Michelle Cook
Current Estimated Value
Purchase Details
Closed on
Mar 6, 2017
Sold by
Gonzales Louis and Gonzales Dolores
Bought by
Cook Ashley Michele and Smtih Ii Steven William
Home Financials for this Owner
Home Financials are based on the most recent Mortgage that was taken out on this home.
Original Mortgage
$230,743
Interest Rate
4.25%
Mortgage Type
FHA
Purchase Details
Closed on
Jun 1, 2005
Sold by
Wendt Shirley Jean K
Bought by
Gonzales Louis and Gonzales Dolores
Home Financials for this Owner
Home Financials are based on the most recent Mortgage that was taken out on this home.
Original Mortgage
$30,000
Interest Rate
5.78%
Mortgage Type
Stand Alone Second
Purchase Details
Closed on
Mar 12, 2004
Sold by
Stern Theresa
Bought by
Cook Ashley Michele and Steven William Smith
Create a Home Valuation Report for This Property
The Home Valuation Report is an in-depth analysis detailing your home's value as well as a comparison with similar homes in the area
Home Values in the Area
Average Home Value in this Area
Purchase History
| Date | Buyer | Sale Price | Title Company |
|---|---|---|---|
| Smith Ashley Michelle Cook | -- | None Available | |
| Cook Ashley Michele | -- | Select Title Llc | |
| Gonzales Louis | -- | Stewart Title Company | |
| Cook Ashley Michele | -- | -- | |
| Cook Ashley Michele | -- | -- |
Source: Public Records
Mortgage History
| Date | Status | Borrower | Loan Amount |
|---|---|---|---|
| Previous Owner | Cook Ashley Michele | $230,743 | |
| Previous Owner | Cook Ashley Michele | $30,000 | |
| Previous Owner | Cook Ashley Michele | $120,000 |
Source: Public Records
Tax History Compared to Growth
Tax History
| Year | Tax Paid | Tax Assessment Tax Assessment Total Assessment is a certain percentage of the fair market value that is determined by local assessors to be the total taxable value of land and additions on the property. | Land | Improvement |
|---|---|---|---|---|
| 2025 | $4,866 | $364,388 | $288,750 | $104,731 |
| 2024 | $4,866 | $331,262 | $199,783 | $131,479 |
| 2023 | $4,866 | $301,147 | $144,287 | $156,860 |
| 2022 | $4,640 | $273,770 | $104,880 | $168,890 |
| 2021 | $4,967 | $248,880 | $108,720 | $140,160 |
| 2020 | $5,509 | $259,670 | $108,720 | $150,950 |
| 2019 | $5,576 | $248,160 | $108,720 | $139,440 |
| 2018 | $5,767 | $256,930 | $102,160 | $154,770 |
| 2017 | $4,685 | $217,800 | $77,610 | $140,190 |
| 2016 | $4,259 | $198,000 | $70,880 | $127,120 |
| 2015 | $2,284 | $180,000 | $44,450 | $135,550 |
| 2014 | $2,353 | $163,640 | $44,450 | $119,190 |
Source: Public Records
Map
Nearby Homes
- 2301 Fm 360 Rd
- 3415 Fm 360 Rd
- 2021 Fm 360 Rd
- 0 Fm 360 Rd
- 412 Fm 360 Rd
- 0 Modena School Rd
- 9503 Cardinal Rd
- 4021 Baker Rd
- 7937 Welch Rd
- 2407 Thuesen Rd
- 7702 Vincik Ehlert Rd
- 4622 Hill Side Ln
- 7802 Brinkmeyer Rd
- 10630 Brinkmeyer Rd
- 9218 E Creek Bend Dr
- 9211 E Creek Bend Dr
- 10410 Birds Nest Dr
- 10407 Rocky Trail
- 10414 Birds Nest Dr
- 10402 Rocky Trail
- 2930 Fm 360 Rd
- 2829 Fm 360 Rd
- 2921 Fm 360 Rd
- 2931 Fm 360 Rd
- 3002 Fm 360 Rd
- 2815 Fm 360 Rd
- 8959 Lucky Ln
- 2811 Fm 360 Rd
- 3011 Fm 360 Rd
- 2810 Bull Run St
- 9211 Wernecke Rd
- 8925 Lucky Ln
- 2623 Fm 360 Rd
- 2918 Bull Run St
- 3035 Fm 360 Rd
- 2609 Fm 360 Rd
- 2529 Fm 360 Rd
- 3020 Henson Rd
- 3018 Bull Run St
- 3016 Henson Rd