Estimated Value: $448,320 - $488,000
4
Beds
3
Baths
2,062
Sq Ft
$227/Sq Ft
Est. Value
About This Home
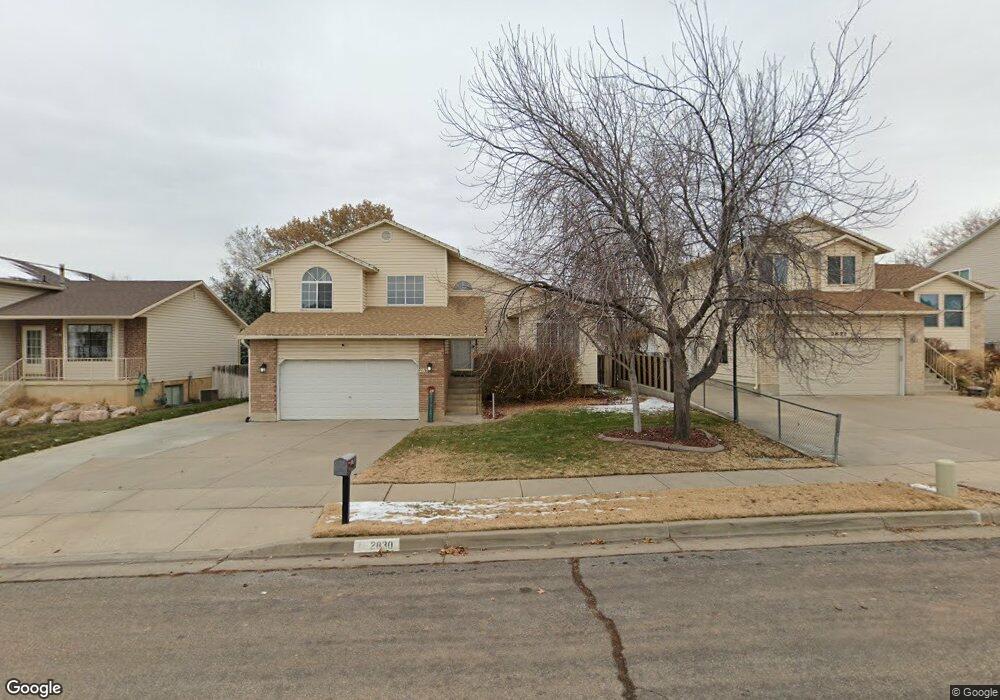
This home is located at 2830 W 4400 S, Roy, UT 84067 and is currently estimated at $469,080, approximately $227 per square foot. 2830 W 4400 S is a home located in Weber County with nearby schools including Midland School, Sand Ridge Junior High School, and Roy High School.
Ownership History
Date
Name
Owned For
Owner Type
Purchase Details
Closed on
Feb 8, 2024
Sold by
Paras Noah T
Bought by
Andrew And Brooke Paras Revocable Living Trus and Paras
Current Estimated Value
Purchase Details
Closed on
Feb 8, 2019
Sold by
Harris Matthew J and Harris Amanda
Bought by
Paras Noah T
Home Financials for this Owner
Home Financials are based on the most recent Mortgage that was taken out on this home.
Original Mortgage
$224,000
Interest Rate
4.5%
Mortgage Type
New Conventional
Purchase Details
Closed on
Sep 15, 2016
Sold by
Taranto Joseph R and Taranto Jo L
Bought by
Harris Matthew J and Harris Amanda
Home Financials for this Owner
Home Financials are based on the most recent Mortgage that was taken out on this home.
Original Mortgage
$239,411
Interest Rate
3.43%
Mortgage Type
VA
Create a Home Valuation Report for This Property
The Home Valuation Report is an in-depth analysis detailing your home's value as well as a comparison with similar homes in the area
Home Values in the Area
Average Home Value in this Area
Purchase History
| Date | Buyer | Sale Price | Title Company |
|---|---|---|---|
| Andrew And Brooke Paras Revocable Living Trus | -- | Us Title | |
| Paras Noah T | -- | First Amer Fashion Pointe | |
| Harris Matthew J | -- | Hickman Land Title Co |
Source: Public Records
Mortgage History
| Date | Status | Borrower | Loan Amount |
|---|---|---|---|
| Previous Owner | Paras Noah T | $224,000 | |
| Previous Owner | Harris Matthew J | $239,411 |
Source: Public Records
Tax History Compared to Growth
Tax History
| Year | Tax Paid | Tax Assessment Tax Assessment Total Assessment is a certain percentage of the fair market value that is determined by local assessors to be the total taxable value of land and additions on the property. | Land | Improvement |
|---|---|---|---|---|
| 2025 | $2,792 | $445,784 | $133,568 | $312,216 |
| 2024 | $2,724 | $438,000 | $133,399 | $304,601 |
| 2023 | $2,503 | $220,550 | $72,173 | $148,377 |
| 2022 | $2,594 | $235,950 | $61,322 | $174,628 |
| 2021 | $2,234 | $335,000 | $76,506 | $258,494 |
| 2020 | $2,073 | $285,000 | $76,506 | $208,494 |
| 2019 | $2,030 | $263,000 | $46,187 | $216,813 |
| 2018 | $1,921 | $234,000 | $46,187 | $187,813 |
| 2017 | $1,863 | $213,000 | $44,238 | $168,762 |
| 2016 | $1,719 | $105,144 | $25,224 | $79,920 |
| 2015 | $1,540 | $95,874 | $25,224 | $70,650 |
| 2014 | $1,528 | $94,094 | $24,773 | $69,321 |
Source: Public Records
Map
Nearby Homes
- 2816 W 4400 S
- 2802 W 4375 S
- 2835 W 4200 S
- 2979 W 4275 S
- 2777 W 4175 S Unit 229
- 2778 W 4175 S Unit 235
- 2642 W 4400 S
- 3084 W 4375 S
- 4635 S 2950 W
- 4118 Westlake Dr
- 4022 S 2725 W
- 3014 W 4750 S
- 1952 W 5450 S
- 2917 W 3970 S Unit 53
- 4440 Stone Creek Rd Unit 2E
- 4670 S 2525 W
- 3891 S 2940 W
- 3866 S 2970 W
- 3046 W 4850 S
- 4510 Stone Creek Rd Unit F