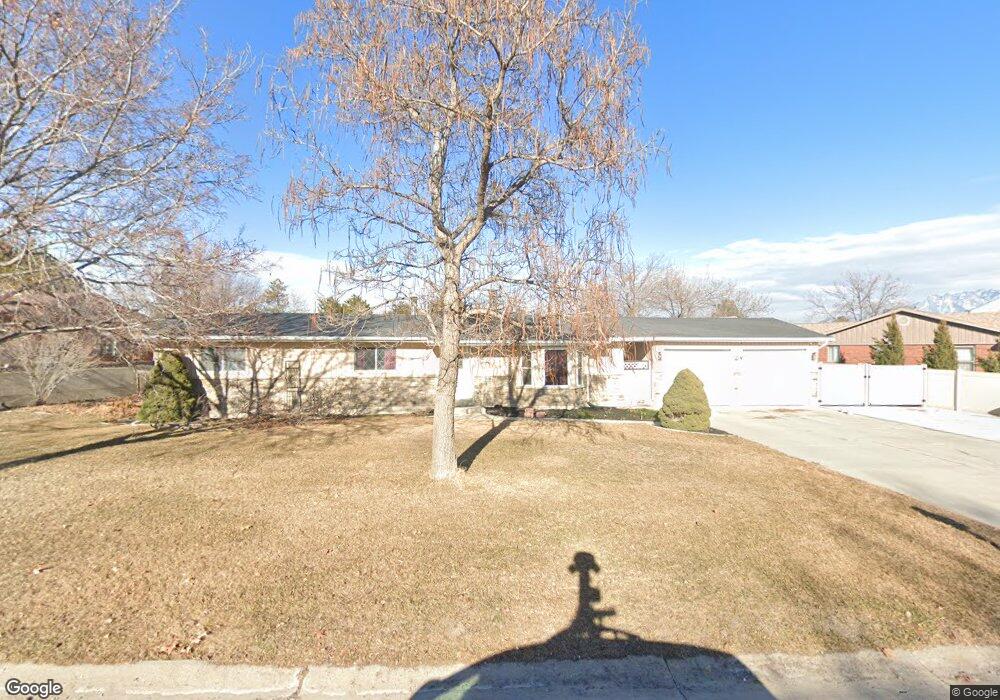
2830 W 6870 S West Jordan, UT 84084
Estimated Value: $536,000 - $630,000
3
Beds
2
Baths
2,864
Sq Ft
$205/Sq Ft
Est. Value
About This Home
This home is located at 2830 W 6870 S, West Jordan, UT 84084 and is currently estimated at $586,494, approximately $204 per square foot. 2830 W 6870 S is a home located in Salt Lake County with nearby schools including West Jordan Middle School, West Jordan High School, and Learning Tree School - Southwest.
Ownership History
Date
Name
Owned For
Owner Type
Purchase Details
Closed on
Apr 12, 2016
Sold by
Larsen Gary O and Larsen Bonita D
Bought by
Larsen Family Living Trust and Larsen Bonita D
Current Estimated Value
Home Financials for this Owner
Home Financials are based on the most recent Mortgage that was taken out on this home.
Original Mortgage
$102,000
Outstanding Balance
$43,294
Interest Rate
2.94%
Mortgage Type
New Conventional
Estimated Equity
$543,200
Purchase Details
Closed on
Apr 15, 2005
Sold by
Larsen Gary O and Larsen Bonita D
Bought by
Larsen Gary O and Larsen Bonita D
Purchase Details
Closed on
Nov 29, 1995
Sold by
Bean W Lee
Bought by
Larsen Gary O and Larsen Bonita D
Home Financials for this Owner
Home Financials are based on the most recent Mortgage that was taken out on this home.
Original Mortgage
$94,000
Interest Rate
7.42%
Create a Home Valuation Report for This Property
The Home Valuation Report is an in-depth analysis detailing your home's value as well as a comparison with similar homes in the area
Home Values in the Area
Average Home Value in this Area
Purchase History
| Date | Buyer | Sale Price | Title Company |
|---|---|---|---|
| Larsen Family Living Trust | -- | Title Guarantee S Jordan | |
| Larsen Gary O | -- | Title Guarantee | |
| Larsen Gary O | -- | -- | |
| Larsen Gary O | -- | -- |
Source: Public Records
Mortgage History
| Date | Status | Borrower | Loan Amount |
|---|---|---|---|
| Open | Larsen Gary O | $102,000 | |
| Closed | Larsen Gary O | $94,000 |
Source: Public Records
Tax History Compared to Growth
Tax History
| Year | Tax Paid | Tax Assessment Tax Assessment Total Assessment is a certain percentage of the fair market value that is determined by local assessors to be the total taxable value of land and additions on the property. | Land | Improvement |
|---|---|---|---|---|
| 2025 | $2,790 | $570,700 | $193,500 | $377,200 |
| 2024 | $2,790 | $536,800 | $186,000 | $350,800 |
| 2023 | $2,768 | $501,900 | $184,200 | $317,700 |
| 2022 | $2,852 | $508,800 | $180,600 | $328,200 |
| 2021 | $2,284 | $370,900 | $150,500 | $220,400 |
| 2020 | $2,301 | $350,700 | $150,500 | $200,200 |
| 2019 | $2,240 | $334,800 | $126,400 | $208,400 |
| 2018 | $0 | $299,200 | $117,800 | $181,400 |
| 2017 | $1,906 | $281,300 | $117,800 | $163,500 |
| 2016 | $1,856 | $257,400 | $117,800 | $139,600 |
| 2015 | $1,771 | $239,400 | $119,900 | $119,500 |
| 2014 | $1,608 | $214,000 | $108,700 | $105,300 |
Source: Public Records
Map
Nearby Homes
- 8524 S Michele River Ave W Unit 109
- 2683 W Carson Ln
- 6893 S 3200 W
- 6918 S Harvest Cir
- 6512 Timpanogos Way
- 2421 W 6900 S
- 3383 W 6880 S
- 6672 S 3335 W
- 6453 Fremont Peak Cir
- 3226 Tysonbrook Ct
- 3052 W Matterhorn Dr
- 7361 S 2700 W
- 2312 W Hidden Bend Cove Unit 107
- 3305 W Kingsbrook Ave
- 6968 S 3535 W Unit 3
- 6980 S 3535 W Unit 2
- 6924 S 2160 W
- 2333 W Ledgewood Dr
- 6482 S Gold Medal Dr
- 6863 S Dixie Dr