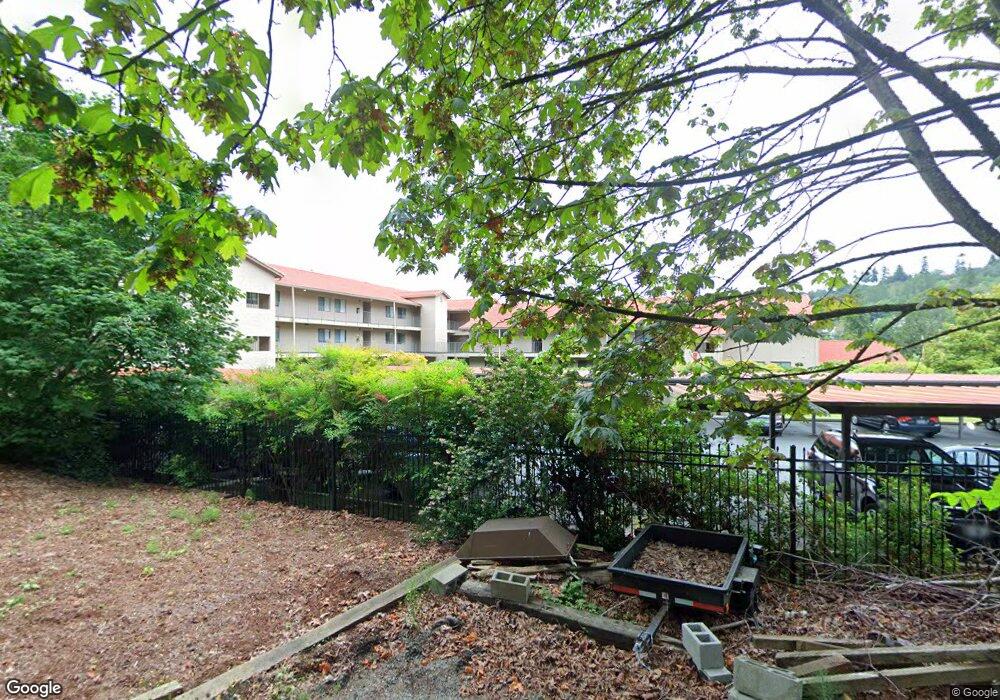
28303 Sound View Dr S Unit 202 Des Moines, WA 98198
Redondo-Des Moines NeighborhoodEstimated Value: $555,000 - $761,000
2
Beds
2
Baths
1,442
Sq Ft
$434/Sq Ft
Est. Value
About This Home
This home is located at 28303 Sound View Dr S Unit 202, Des Moines, WA 98198 and is currently estimated at $626,213, approximately $434 per square foot. 28303 Sound View Dr S Unit 202 is a home located in King County with nearby schools including Nautilus K-8 School, Sacajawea Middle School, and Federal Way High School.
Ownership History
Date
Name
Owned For
Owner Type
Purchase Details
Closed on
Feb 21, 2006
Sold by
Hubbard Lori J
Bought by
Eide D Mark and Eide Tracey J
Current Estimated Value
Home Financials for this Owner
Home Financials are based on the most recent Mortgage that was taken out on this home.
Original Mortgage
$38,600
Interest Rate
5.66%
Mortgage Type
Stand Alone Second
Purchase Details
Closed on
Nov 22, 2002
Sold by
Ruiz Larissa
Bought by
Hubbard Lori J
Home Financials for this Owner
Home Financials are based on the most recent Mortgage that was taken out on this home.
Original Mortgage
$137,500
Interest Rate
5.52%
Purchase Details
Closed on
Feb 1, 1999
Sold by
Faulk Ernest E and Faulk Wilma M
Bought by
Ruiz Larissa
Home Financials for this Owner
Home Financials are based on the most recent Mortgage that was taken out on this home.
Original Mortgage
$171,950
Interest Rate
6.73%
Create a Home Valuation Report for This Property
The Home Valuation Report is an in-depth analysis detailing your home's value as well as a comparison with similar homes in the area
Home Values in the Area
Average Home Value in this Area
Purchase History
| Date | Buyer | Sale Price | Title Company |
|---|---|---|---|
| Eide D Mark | $386,000 | Stewart Title | |
| Hubbard Lori J | $64,156 | Chicago Title | |
| Ruiz Larissa | $214,950 | Fidelity National Title |
Source: Public Records
Mortgage History
| Date | Status | Borrower | Loan Amount |
|---|---|---|---|
| Closed | Eide D Mark | $38,600 | |
| Open | Eide D Mark | $308,800 | |
| Previous Owner | Hubbard Lori J | $137,500 | |
| Previous Owner | Ruiz Larissa | $171,950 |
Source: Public Records
Tax History Compared to Growth
Tax History
| Year | Tax Paid | Tax Assessment Tax Assessment Total Assessment is a certain percentage of the fair market value that is determined by local assessors to be the total taxable value of land and additions on the property. | Land | Improvement |
|---|---|---|---|---|
| 2024 | $6,239 | $567,000 | $51,700 | $515,300 |
| 2023 | $4,965 | $519,000 | $48,900 | $470,100 |
| 2022 | $4,892 | $490,000 | $45,100 | $444,900 |
| 2021 | $5,325 | $421,000 | $45,100 | $375,900 |
| 2020 | $4,775 | $431,000 | $45,100 | $385,900 |
| 2018 | $5,332 | $383,000 | $45,100 | $337,900 |
| 2017 | $5,471 | $361,000 | $26,300 | $334,700 |
| 2016 | $5,536 | $369,000 | $26,300 | $342,700 |
| 2015 | $5,195 | $356,000 | $26,300 | $329,700 |
| 2014 | -- | $342,000 | $21,600 | $320,400 |
| 2013 | -- | $250,000 | $18,800 | $231,200 |
Source: Public Records
Map
Nearby Homes
- 28313 Redondo Way S Unit 304
- 28313 Redondo Way S Unit 102
- 28529 10th Ave S
- 28120 Redondo Beach Dr S Unit 206
- 1110 S 287th St
- 28601 13th Ave S
- 1361 S 279th St
- 28610 16th Ave S Unit 103
- 29318 9th Place S
- 28606 16th Ave S Unit 102
- 1111 S 274th Place
- 29020 1st Ave S Unit 37
- 28311 18th Ave S Unit A304
- 28821 18th Ave S
- 29419 4th Ave S
- 28716 18th Ave S Unit Y203
- 1835 S 286th Ln Unit R-201
- 824 S 296th Place
- 220 SW 292nd St
- 29500 2nd Ave SW
- 28303 Sound View Dr S
- 28303 Sound View Dr S Unit 109
- 28303 Sound View Dr S Unit 302
- 28303 Sound View Dr S Unit 102
- 28303 Sound View Dr S Unit 209
- 28303 Sound View Dr S Unit 210
- 28303 Sound View Dr S Unit 208
- 28303 Sound View Dr S Unit 310
- 28303 Sound View Dr S Unit 110
- 28303 Sound View Dr S Unit 406
- 28303 Sound View Dr S Unit 203
- 28303 Sound View Dr S Unit 207
- 28303 Sound View Dr S Unit 204
- 28303 Sound View Dr S Unit 306
- 28303 Sound View Dr S Unit 103
- 28303 Sound View Dr S Unit 304
- 28303 Sound View Dr S Unit 201
- 28303 Sound View Dr S Unit 405
- 28303 Sound View Dr S Unit 403
- 28303 Sound View Dr S Unit 402