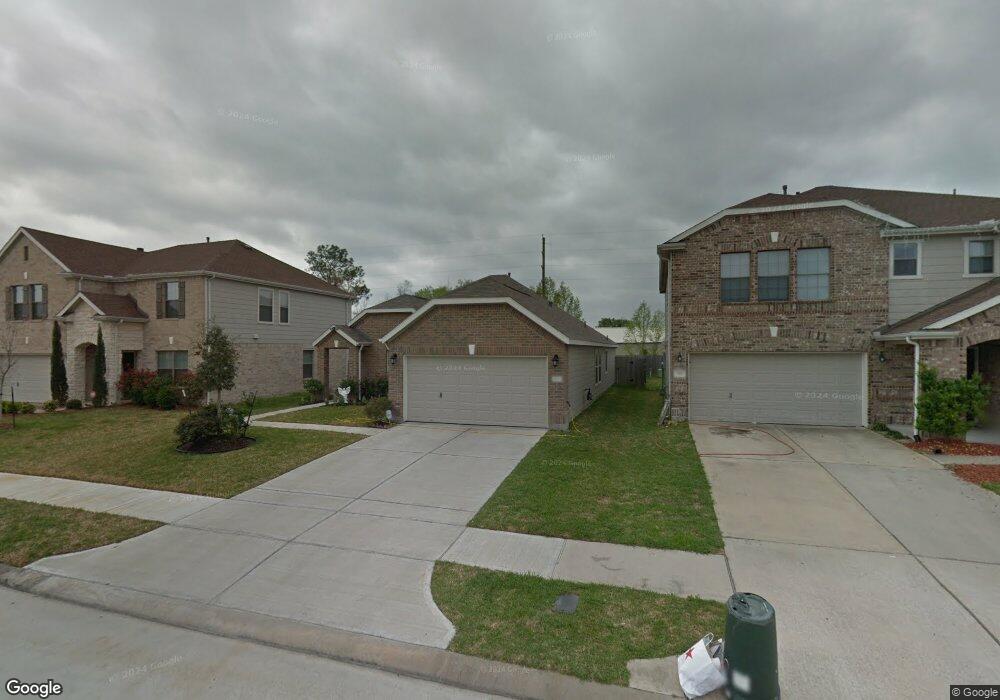
2831 Banff Mountain Trail Houston, TX 77038
North Houston NeighborhoodEstimated Value: $236,750 - $249,000
3
Beds
2
Baths
1,825
Sq Ft
$133/Sq Ft
Est. Value
About This Home
This home is located at 2831 Banff Mountain Trail, Houston, TX 77038 and is currently estimated at $243,438, approximately $133 per square foot. 2831 Banff Mountain Trail is a home located in Harris County with nearby schools including Kujawa EC/Pre-K/K School, Carter Academy, and Shotwell Middle School.
Ownership History
Date
Name
Owned For
Owner Type
Purchase Details
Closed on
Jan 22, 2016
Sold by
Carrillo Iniguez Eva M and Iniguez Oscar N
Bought by
Carrillo Iniguez Eva M and Iniguez Oscar N
Current Estimated Value
Home Financials for this Owner
Home Financials are based on the most recent Mortgage that was taken out on this home.
Original Mortgage
$96,352
Outstanding Balance
$77,350
Interest Rate
4.25%
Mortgage Type
FHA
Estimated Equity
$166,088
Purchase Details
Closed on
May 20, 2009
Sold by
Kb Home Lone Star Inc
Bought by
Carrillo Eva M and Iniguez Oscar N
Home Financials for this Owner
Home Financials are based on the most recent Mortgage that was taken out on this home.
Original Mortgage
$115,831
Interest Rate
4.84%
Mortgage Type
FHA
Create a Home Valuation Report for This Property
The Home Valuation Report is an in-depth analysis detailing your home's value as well as a comparison with similar homes in the area
Home Values in the Area
Average Home Value in this Area
Purchase History
| Date | Buyer | Sale Price | Title Company |
|---|---|---|---|
| Carrillo Iniguez Eva M | -- | Attorney | |
| Carrillo Eva M | -- | First American Title |
Source: Public Records
Mortgage History
| Date | Status | Borrower | Loan Amount |
|---|---|---|---|
| Open | Carrillo Iniguez Eva M | $96,352 | |
| Closed | Carrillo Eva M | $115,831 |
Source: Public Records
Tax History Compared to Growth
Tax History
| Year | Tax Paid | Tax Assessment Tax Assessment Total Assessment is a certain percentage of the fair market value that is determined by local assessors to be the total taxable value of land and additions on the property. | Land | Improvement |
|---|---|---|---|---|
| 2025 | $5,310 | $234,303 | $54,520 | $179,783 |
| 2024 | $5,310 | $221,690 | $54,520 | $167,170 |
| 2023 | $5,310 | $246,936 | $54,520 | $192,416 |
| 2022 | $5,994 | $213,751 | $30,443 | $183,308 |
| 2021 | $5,661 | $163,838 | $30,443 | $133,395 |
| 2020 | $5,477 | $158,987 | $30,443 | $128,544 |
| 2019 | $5,128 | $146,230 | $22,140 | $124,090 |
| 2018 | $1,461 | $133,809 | $22,140 | $111,669 |
| 2017 | $4,109 | $133,809 | $22,140 | $111,669 |
| 2016 | $3,735 | $133,809 | $22,140 | $111,669 |
| 2015 | $2,747 | $133,809 | $22,140 | $111,669 |
| 2014 | $2,747 | $99,354 | $22,140 | $77,214 |
Source: Public Records
Map
Nearby Homes
- 2930 Washington Dr
- 2934 Washington Dr
- 11623 Quinn Ridge Way
- 9218 Washington Dr
- 9217 Washington Dr
- 9206 Washington Dr
- 11638 Township Dale Ct
- 11618 Wren Crossing Dr
- 2845 Washington Dr
- 2846 W Mount Houston Rd
- 11707 Madison Oak St
- 11726 Wren Crossing Dr
- 2746 Piney Lake Ct
- 2743 Oriole Wood Ct
- 2631 Palmetto Valley Dr
- 11727 State Highway 249
- 2615 Palmetto Valley Dr
- 2907 Valiant Scene Ct
- 2934 Valiant Scene Ct
- 2606 Oakwood Bluff Trail
- 2827 Banff Mountain Trail
- 2839 Banff Mountain Trail
- 2823 Banff Mountain Trail
- 2843 Banff Mountain Trail
- 2819 Banff Mountain Trail
- 11603 Alpine Vale Ct
- 11602 Alpine Vale Ct
- 11607 Alpine Vale Ct
- 2815 Banff Mountain Trail
- 11606 Alpine Vale Ct
- 11602 Quinn Ridge Way
- 2847 Banff Mountain Trail
- 11611 Alpine Vale Ct
- 11606 Quinn Ridge Way
- 2811 Banff Mountain Trail
- 11610 Alpine Vale Ct
- 11610 Quinn Ridge Way
- 2851 Banff Mountain Trail
- 11603 Sunlit Leaf Ct
- 11615 Alpine Vale Ct