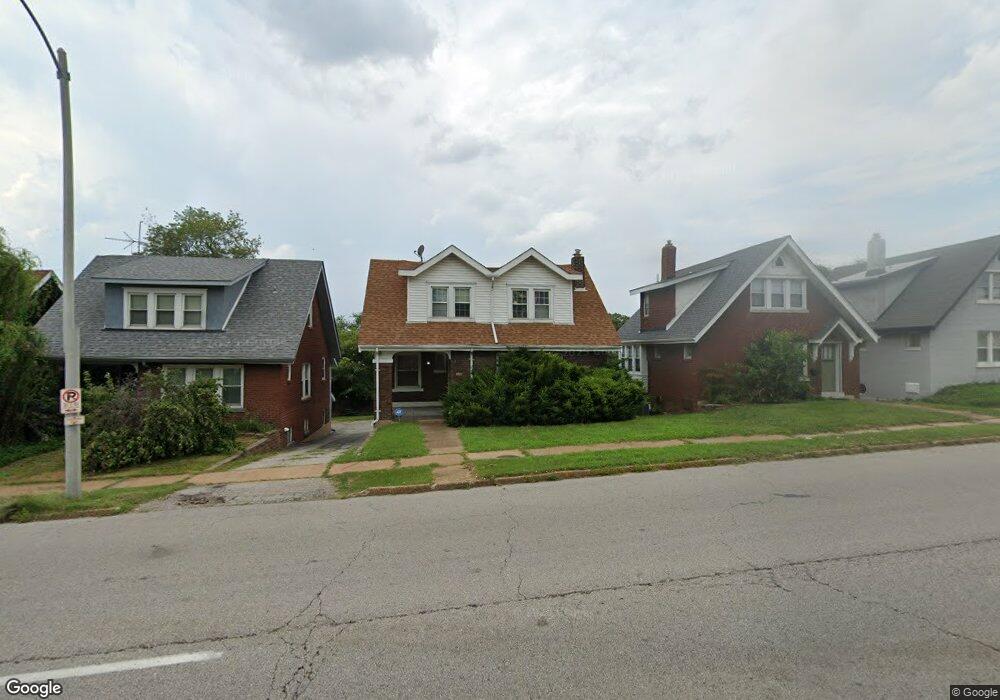
2831 Hampton Ave Saint Louis, MO 63139
Clifton Heights NeighborhoodEstimated Value: $195,347 - $219,000
Studio
2
Baths
1,550
Sq Ft
$132/Sq Ft
Est. Value
About This Home
This home is located at 2831 Hampton Ave, Saint Louis, MO 63139 and is currently estimated at $204,337, approximately $131 per square foot. 2831 Hampton Ave is a home located in St. Louis City with nearby schools including Mason Elementary School, Long International Middle School, and Roosevelt High School.
Ownership History
Date
Name
Owned For
Owner Type
Purchase Details
Closed on
Jul 9, 2025
Sold by
Truong Natasha C
Bought by
Truong Natasha C and Vu Minh Tam
Current Estimated Value
Purchase Details
Closed on
Oct 25, 2019
Sold by
Thivu Minh Tam and Truong Minh Quany
Bought by
Truong Natasha C
Purchase Details
Closed on
Oct 6, 2016
Sold by
Vu Minh Tam Thi and Truaong Minh Quang
Bought by
Vu Min Tam Thi and Truong Minh Quang
Purchase Details
Closed on
Nov 12, 2015
Sold by
City Of St Louis
Bought by
Vu Minhtam Thi
Purchase Details
Closed on
Oct 23, 2015
Sold by
Vu Minhtam Thi
Bought by
Vu Minh Tam Thi and Truong Minh Q
Purchase Details
Closed on
Jun 10, 2002
Sold by
Blazer David M and Blazer Ruby
Bought by
Wichmann Kenneth and Wichmann Cynthia
Purchase Details
Closed on
Jul 6, 2000
Sold by
Martin Susan R and Martin Roger Martin
Bought by
Blazer David M
Create a Home Valuation Report for This Property
The Home Valuation Report is an in-depth analysis detailing your home's value as well as a comparison with similar homes in the area
Home Values in the Area
Average Home Value in this Area
Purchase History
We collect this data history from publicly available records. To have your information removed, we recommend requesting removal directly through your county’s website.
| Date | Buyer | Sale Price | Title Company |
|---|---|---|---|
| Truong Natasha C | -- | None Listed On Document | |
| Truong Natasha C | -- | None Available | |
| Vu Min Tam Thi | -- | None Available | |
| Vu Minhtam Thi | $62,000 | None Available | |
| Vu Minh Tam Thi | -- | None Available | |
| Wichmann Kenneth | -- | -- | |
| Blazer David M | -- | -- |
Source: Public Records
Tax History
| Year | Tax Paid | Tax Assessment Tax Assessment Total Assessment is a certain percentage of the fair market value that is determined by local assessors to be the total taxable value of land and additions on the property. | Land | Improvement |
|---|---|---|---|---|
| 2025 | $2,428 | $33,620 | $6,210 | $27,410 |
| 2024 | $2,310 | $28,670 | $6,210 | $22,460 |
| 2023 | $2,310 | $28,670 | $6,210 | $22,460 |
| 2022 | $2,200 | $26,270 | $6,210 | $20,060 |
| 2021 | $2,196 | $26,270 | $6,210 | $20,060 |
| 2020 | $1,965 | $23,650 | $6,210 | $17,440 |
| 2019 | $1,958 | $23,650 | $6,210 | $17,440 |
| 2018 | $1,297 | $22,900 | $5,550 | $17,350 |
| 2017 | $1,206 | $14,230 | $6,210 | $8,020 |
| 2016 | $1,788 | $21,000 | $5,550 | $15,450 |
| 2015 | $1,622 | $21,000 | $5,550 | $15,450 |
| 2014 | $3,100 | $21,000 | $5,550 | $15,450 |
| 2013 | -- | $40,500 | $11,200 | $29,300 |
Source: Public Records
Map
Nearby Homes
- 5962 S Cuba Ct
- 2830 Hampton Ave
- 2828 59th St
- 2830 59th St
- 3119 Park Hampton Ct
- 5816 Reber Place
- 6075 Hartford St
- 2707 Dalton Ave
- 2725 January Ave
- 6024 Scanlan Ave
- 3215 Jasper Park
- 6266 Marmaduke Ave
- 3176 Harlequin Ln
- 5636 Columbia Ave
- 2637 Pearl Ave
- 6284 Reber Place
- 2339 Sulphur Ave
- 3166 Tamm Ave
- 5621 Botanical Ave
- 6034 Elizabeth Ave
- 2827 Hampton Ave
- 2835 Hampton Ave
- 5963 N Cuba Ct
- 2839 Hampton Ave
- 2823 Hampton Ave
- 2843 Hampton Ave
- 5969 N Cuba Ct
- 2847 Hampton Ave
- 2807 Hampton Ave
- 5971 N Cuba Ct
- 2826 Hampton Ave
- 5971 S Cuba Ct
- 2849 Hampton Ave
- 5936 Southwest Ave
- 5975 S Cuba Ct
- 5966 S Cuba Ct
- 2834 Hampton Ave
- 5977 N Cuba Ct
- 2801 Hampton Ave
- 5970 S Cuba Ct
Your Personal Tour Guide
Ask me questions while you tour the home.