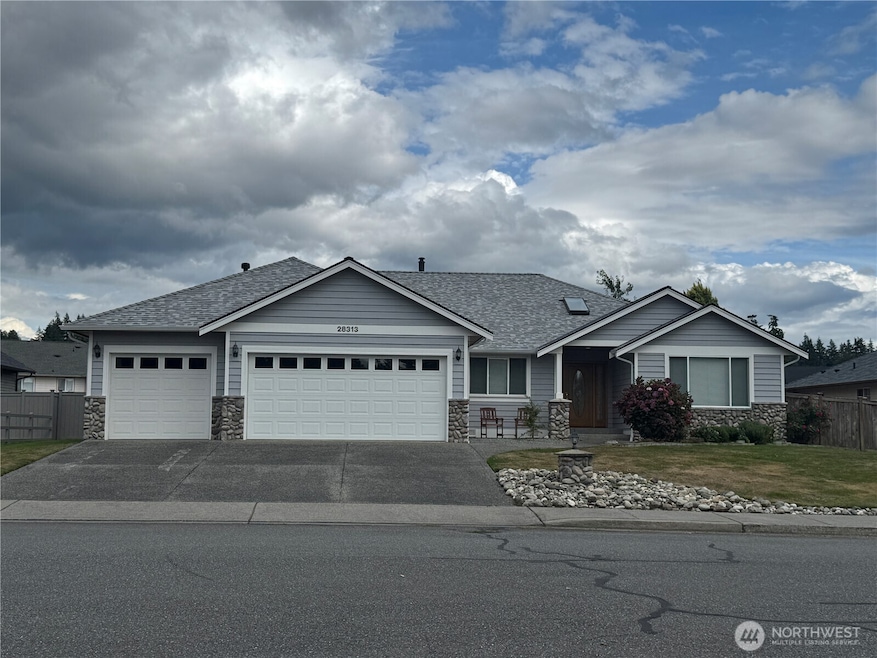
28313 Nordic Way Stanwood, WA 98292
Estimated payment $4,376/month
Highlights
- City View
- Wood Flooring
- 3 Car Attached Garage
- Property is near public transit
- Skylights
- Walk-In Closet
About This Home
Presenting a lovely 4 bed single story home in the highly desirable & well established neighborhood of Pioneer Hills, in the vibrant town of Stanwood. This home sits on .23 of an acre with a private back garden (fenced) & the current owner has just put on a new roof with a 25 year warranty, the home also benefits from cedar siding. With a beautifully kept oak kitchen, a family room and a further reception room, this home offers versatile accommodation. Along with plenty of driveway parking there is a 3 car garage. Take a look, then make that offer before this home is gone!
Source: Northwest Multiple Listing Service (NWMLS)
MLS#: 2424173
Home Details
Home Type
- Single Family
Est. Annual Taxes
- $5,406
Year Built
- Built in 2001
Lot Details
- 10,019 Sq Ft Lot
- West Facing Home
- Property is Fully Fenced
- Level Lot
- Sprinkler System
HOA Fees
- $17 Monthly HOA Fees
Parking
- 3 Car Attached Garage
- Driveway
Home Design
- Poured Concrete
- Composition Roof
- Wood Siding
- Stone Siding
- Stone
Interior Spaces
- 2,416 Sq Ft Home
- 1-Story Property
- Skylights
- Self Contained Fireplace Unit Or Insert
- Gas Fireplace
- City Views
Kitchen
- Stove
- Dishwasher
- Disposal
Flooring
- Wood
- Carpet
- Ceramic Tile
- Vinyl
Bedrooms and Bathrooms
- 4 Main Level Bedrooms
- Walk-In Closet
- Bathroom on Main Level
- 2 Full Bathrooms
Outdoor Features
- Patio
Location
- Property is near public transit
- Property is near a bus stop
Utilities
- Water Heater
- Cable TV Available
Community Details
- Pioneer Hills Subdivision
- The community has rules related to covenants, conditions, and restrictions
Listing and Financial Details
- Down Payment Assistance Available
- Visit Down Payment Resource Website
- Assessor Parcel Number 00890600001500
Map
Home Values in the Area
Average Home Value in this Area
Tax History
| Year | Tax Paid | Tax Assessment Tax Assessment Total Assessment is a certain percentage of the fair market value that is determined by local assessors to be the total taxable value of land and additions on the property. | Land | Improvement |
|---|---|---|---|---|
| 2025 | $5,082 | $643,400 | $227,000 | $416,400 |
| 2024 | $5,082 | $597,400 | $181,000 | $416,400 |
| 2023 | $5,294 | $655,800 | $230,000 | $425,800 |
| 2022 | $5,018 | $506,200 | $166,000 | $340,200 |
| 2020 | $4,989 | $462,100 | $140,000 | $322,100 |
| 2019 | $4,597 | $432,600 | $130,000 | $302,600 |
| 2018 | $4,550 | $407,000 | $110,000 | $297,000 |
| 2017 | $3,938 | $367,000 | $87,000 | $280,000 |
| 2016 | $3,824 | $350,000 | $81,000 | $269,000 |
| 2015 | $3,391 | $313,800 | $69,000 | $244,800 |
| 2013 | $3,307 | $286,100 | $80,000 | $206,100 |
Property History
| Date | Event | Price | Change | Sq Ft Price |
|---|---|---|---|---|
| 08/29/2025 08/29/25 | Pending | -- | -- | -- |
| 08/21/2025 08/21/25 | For Sale | $740,000 | -- | $306 / Sq Ft |
Purchase History
| Date | Type | Sale Price | Title Company |
|---|---|---|---|
| Warranty Deed | $310,000 | Rainier Title Llc | |
| Warranty Deed | $269,999 | -- | |
| Warranty Deed | $68,500 | -- |
Mortgage History
| Date | Status | Loan Amount | Loan Type |
|---|---|---|---|
| Open | $50,000 | Credit Line Revolving | |
| Closed | $60,000 | Credit Line Revolving | |
| Open | $139,000 | New Conventional | |
| Open | $248,000 | New Conventional | |
| Previous Owner | $135,000 | No Value Available |
Source: Northwest Multiple Listing Service (NWMLS)
MLS Number: 2424173
APN: 008906-000-015-00
Disclaimer: Certain information contained herein is derived from information provided by parties other than Homes.com. All information provided is deemed reliable, but is not guaranteed to be accurate and should be independently verified.
![]() All data is obtained from various sources and may not have been verified by broker or MLS GRID. Supplied Open House Information is subject to change without notice. All information should be independently reviewed and verified for accuracy. Properties may or may not be listed by the office/agent presenting the information. Listing information is provided by the Northwest Multiple Listing Service (NWMLS). Property information is based on available data that may include MLS information, county records, and other sources. Listings marked with the 3 tree icon and provided by NWMLS. All properties are subject to prior sale or withdrawal. IDX information is provided exclusively for consumers’ personal noncommercial use, that it may not be used for any purpose other than to identify prospective properties consumers may be interested in purchasing, that the data is deemed reliable but is not guaranteed by MLS GRID. ©2025 NWMLS.
All data is obtained from various sources and may not have been verified by broker or MLS GRID. Supplied Open House Information is subject to change without notice. All information should be independently reviewed and verified for accuracy. Properties may or may not be listed by the office/agent presenting the information. Listing information is provided by the Northwest Multiple Listing Service (NWMLS). Property information is based on available data that may include MLS information, county records, and other sources. Listings marked with the 3 tree icon and provided by NWMLS. All properties are subject to prior sale or withdrawal. IDX information is provided exclusively for consumers’ personal noncommercial use, that it may not be used for any purpose other than to identify prospective properties consumers may be interested in purchasing, that the data is deemed reliable but is not guaranteed by MLS GRID. ©2025 NWMLS.
Based on information submitted to the MLS GRID
- 28124 85th Dr NW
- 28400 83rd Dr NW
- 28303 83rd Dr NW
- 8329 282nd St NW
- 0 84th Dr NW
- 8051 283rd St NW
- 28407 Pioneer Hwy
- 8013 283rd St NW
- 28508 80th Dr NW
- 27620 84th Dr NW
- 7403 280th Place NW Unit 46
- 7404 280th Place NW Unit 30
- 7403 280th Place NW Unit 45
- 7907 285th Place NW
- 8330 276th Place NW Unit 3
- 7702 284th St NW
- 27519 82nd Dr NW
- 7725 278th Place NW
- 8200 Hennings Dr
- 28515 76th Dr NW
