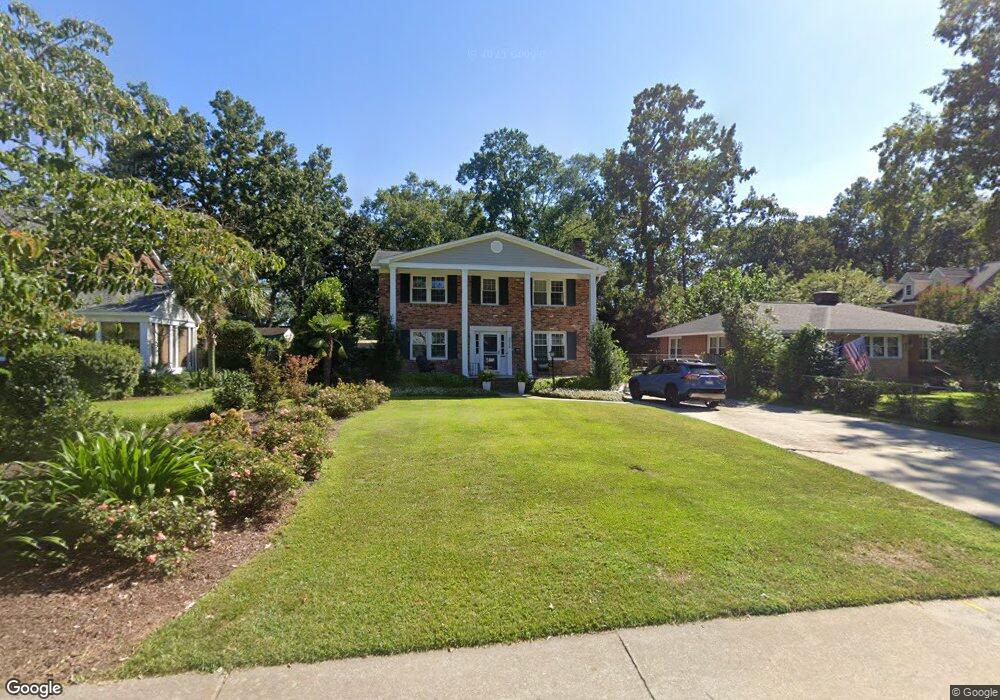
2832 Burney Dr Columbia, SC 29205
Rosewood NeighborhoodEstimated Value: $549,000 - $744,000
5
Beds
4
Baths
2,750
Sq Ft
$242/Sq Ft
Est. Value
About This Home
This home is located at 2832 Burney Dr, Columbia, SC 29205 and is currently estimated at $665,794, approximately $242 per square foot. 2832 Burney Dr is a home located in Richland County with nearby schools including Rosewood Elementary School, Hand Middle School, and Dreher High School.
Ownership History
Date
Name
Owned For
Owner Type
Purchase Details
Closed on
Feb 19, 2020
Sold by
Morgan Carmen T and Willm Robert Lee
Bought by
Willm Carmen and Willm Lee R
Current Estimated Value
Home Financials for this Owner
Home Financials are based on the most recent Mortgage that was taken out on this home.
Original Mortgage
$100,000
Outstanding Balance
$88,543
Interest Rate
3.6%
Mortgage Type
Credit Line Revolving
Estimated Equity
$577,251
Purchase Details
Closed on
Aug 23, 2006
Sold by
Soles Quinn B
Bought by
Morgan Carmen T and Willm Robert Lee
Home Financials for this Owner
Home Financials are based on the most recent Mortgage that was taken out on this home.
Original Mortgage
$284,000
Interest Rate
6.67%
Mortgage Type
Purchase Money Mortgage
Purchase Details
Closed on
Nov 1, 2004
Sold by
King Helen B
Bought by
Soles Quinn B
Home Financials for this Owner
Home Financials are based on the most recent Mortgage that was taken out on this home.
Original Mortgage
$200,000
Interest Rate
5.62%
Mortgage Type
Purchase Money Mortgage
Create a Home Valuation Report for This Property
The Home Valuation Report is an in-depth analysis detailing your home's value as well as a comparison with similar homes in the area
Home Values in the Area
Average Home Value in this Area
Purchase History
| Date | Buyer | Sale Price | Title Company |
|---|---|---|---|
| Willm Carmen | -- | None Available | |
| Morgan Carmen T | $355,000 | None Available | |
| Soles Quinn B | $200,000 | -- |
Source: Public Records
Mortgage History
| Date | Status | Borrower | Loan Amount |
|---|---|---|---|
| Open | Willm Carmen | $100,000 | |
| Previous Owner | Morgan Carmen T | $284,000 | |
| Previous Owner | Soles Quinn B | $200,000 |
Source: Public Records
Tax History Compared to Growth
Tax History
| Year | Tax Paid | Tax Assessment Tax Assessment Total Assessment is a certain percentage of the fair market value that is determined by local assessors to be the total taxable value of land and additions on the property. | Land | Improvement |
|---|---|---|---|---|
| 2024 | $3,475 | $503,800 | $0 | $0 |
| 2023 | $3,475 | $17,524 | $0 | $0 |
| 2022 | $3,176 | $438,100 | $90,000 | $348,100 |
| 2021 | $3,280 | $17,520 | $0 | $0 |
| 2020 | $3,460 | $17,520 | $0 | $0 |
| 2019 | $3,484 | $17,520 | $0 | $0 |
| 2018 | $3,130 | $15,380 | $0 | $0 |
| 2017 | $3,048 | $15,380 | $0 | $0 |
| 2016 | $2,939 | $15,380 | $0 | $0 |
| 2015 | $2,939 | $15,380 | $0 | $0 |
| 2014 | $2,936 | $384,400 | $0 | $0 |
| 2013 | -- | $15,380 | $0 | $0 |
Source: Public Records
Map
Nearby Homes
- 2900 Burney Dr
- 2909 Monroe St
- 516 S Holly St
- 2804 Duncan St
- 2614 Burney Dr
- 2906 Oceola St
- 2600 Kiawah Ave
- 2611 Monroe St
- 2218 Rosewood Dr
- 3121 Duncan St
- 5 Sims Alley
- 716 S Holly St
- 418 S Ravenel St
- 612 S Woodrow St
- 2205 Kennedy St Unit 1 , 2 , 3, 4
- 3402 Rosewood Dr
- 605 Wando St
- 528 Capitol Place
- 529 King St Unit B
- 2214 Superior St