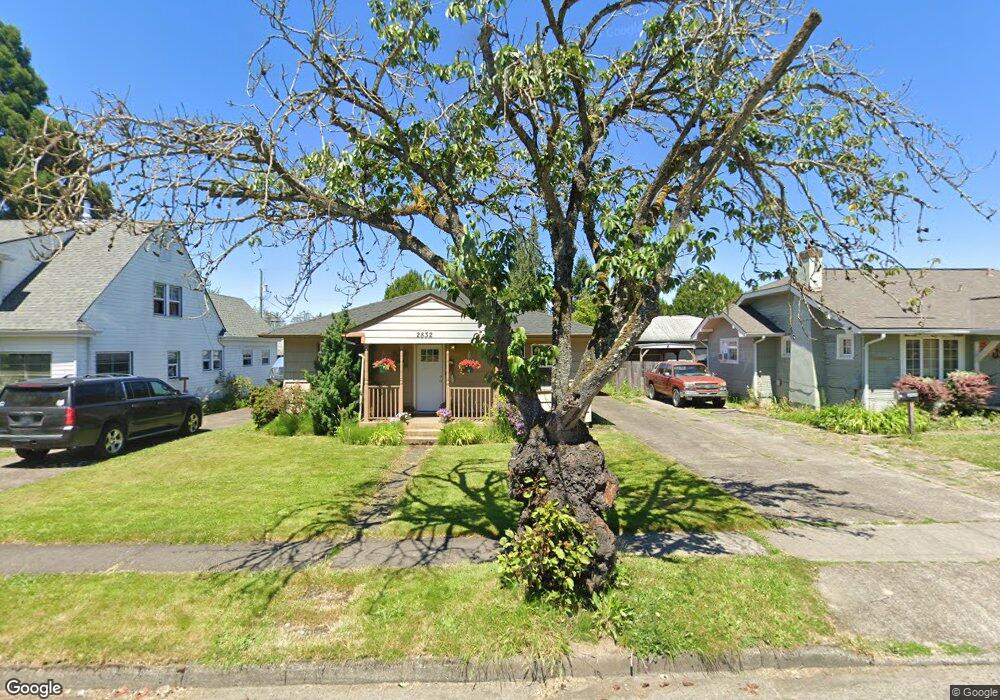
2832 Dover St Longview, WA 98632
Olympic East NeighborhoodEstimated Value: $276,000 - $305,000
2
Beds
1
Bath
808
Sq Ft
$358/Sq Ft
Est. Value
About This Home
This home is located at 2832 Dover St, Longview, WA 98632 and is currently estimated at $289,102, approximately $357 per square foot. 2832 Dover St is a home located in Cowlitz County with nearby schools including Olympic Elementary School, Monticello Middle School, and R.A. Long High School.
Ownership History
Date
Name
Owned For
Owner Type
Purchase Details
Closed on
Aug 28, 2009
Sold by
Mahlum Dale W and Beck Harold J
Bought by
Gross Tirzah A
Current Estimated Value
Home Financials for this Owner
Home Financials are based on the most recent Mortgage that was taken out on this home.
Original Mortgage
$115,371
Interest Rate
5.19%
Mortgage Type
FHA
Create a Home Valuation Report for This Property
The Home Valuation Report is an in-depth analysis detailing your home's value as well as a comparison with similar homes in the area
Home Values in the Area
Average Home Value in this Area
Purchase History
| Date | Buyer | Sale Price | Title Company |
|---|---|---|---|
| Gross Tirzah A | $117,500 | Chicago Title |
Source: Public Records
Mortgage History
| Date | Status | Borrower | Loan Amount |
|---|---|---|---|
| Previous Owner | Gross Tirzah A | $115,371 |
Source: Public Records
Tax History
| Year | Tax Paid | Tax Assessment Tax Assessment Total Assessment is a certain percentage of the fair market value that is determined by local assessors to be the total taxable value of land and additions on the property. | Land | Improvement |
|---|---|---|---|---|
| 2024 | $2,165 | $249,400 | $43,550 | $205,850 |
| 2023 | $2,099 | $241,830 | $43,550 | $198,280 |
| 2022 | $1,973 | $236,060 | $43,550 | $192,510 |
| 2021 | $1,977 | $197,990 | $41,480 | $156,510 |
| 2020 | $1,587 | $178,770 | $41,480 | $137,290 |
| 2019 | $1,462 | $150,434 | $41,475 | $108,959 |
| 2018 | $1,531 | $135,410 | $41,480 | $93,930 |
| 2017 | $1,329 | $116,470 | $39,470 | $77,000 |
| 2016 | $1,149 | $102,920 | $37,600 | $65,320 |
| 2015 | $1,175 | $91,010 | $37,600 | $53,410 |
| 2013 | -- | $83,600 | $36,500 | $47,100 |
Source: Public Records
Map
Nearby Homes
Your Personal Tour Guide
Ask me questions while you tour the home.