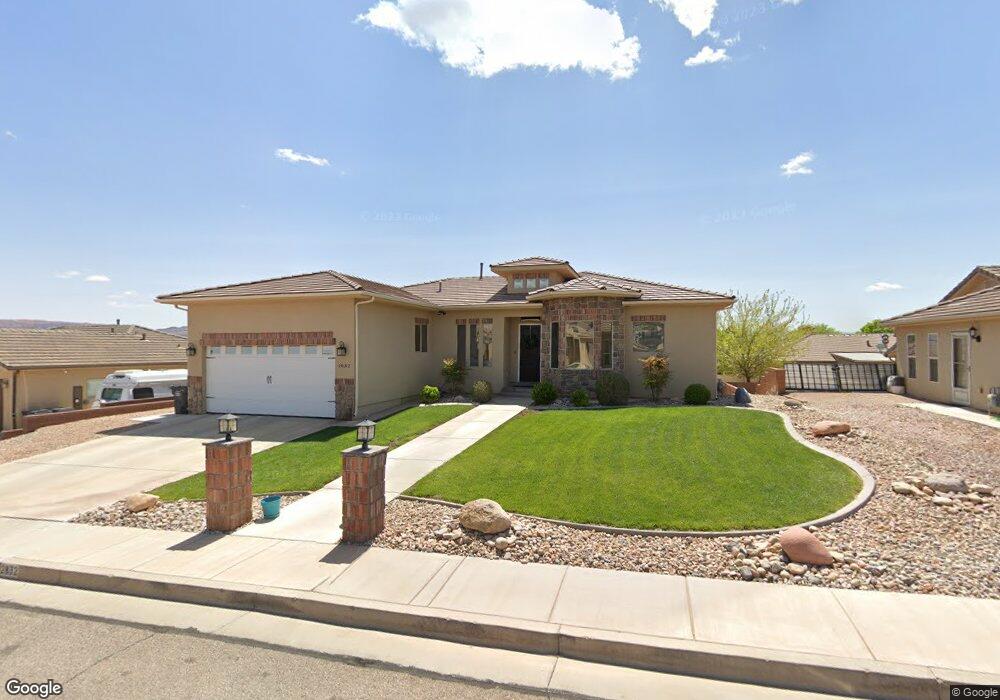
2832 E 410 St N St. George, UT 84790
Estimated Value: $490,872 - $695,000
5
Beds
3
Baths
3,226
Sq Ft
$175/Sq Ft
Est. Value
About This Home
This home is located at 2832 E 410 St N, St. George, UT 84790 and is currently estimated at $564,468, approximately $174 per square foot. 2832 E 410 St N is a home located in Washington County with nearby schools including Panorama School, Pine View Middle School, and Fossil Ridge Intermediate School.
Ownership History
Date
Name
Owned For
Owner Type
Purchase Details
Closed on
Oct 30, 2014
Sold by
Blake Stan
Bought by
Blake Quinn and Blake Ashlye
Current Estimated Value
Home Financials for this Owner
Home Financials are based on the most recent Mortgage that was taken out on this home.
Original Mortgage
$208,000
Outstanding Balance
$160,502
Interest Rate
4.2%
Mortgage Type
New Conventional
Estimated Equity
$403,966
Purchase Details
Closed on
Aug 9, 2013
Sold by
K & K Construction And Development Inc
Bought by
Blake Stan
Purchase Details
Closed on
Sep 20, 2005
Sold by
Avalanche Investments Lc
Bought by
K & K Construction And Development Inc
Home Financials for this Owner
Home Financials are based on the most recent Mortgage that was taken out on this home.
Original Mortgage
$220,000
Interest Rate
5.7%
Mortgage Type
Purchase Money Mortgage
Create a Home Valuation Report for This Property
The Home Valuation Report is an in-depth analysis detailing your home's value as well as a comparison with similar homes in the area
Home Values in the Area
Average Home Value in this Area
Purchase History
| Date | Buyer | Sale Price | Title Company |
|---|---|---|---|
| Blake Quinn | -- | Title Guarantee | |
| Blake Stan | $301,802 | Vendortrak Title Company | |
| K & K Construction And Development Inc | -- | First American Title Co |
Source: Public Records
Mortgage History
| Date | Status | Borrower | Loan Amount |
|---|---|---|---|
| Open | Blake Quinn | $208,000 | |
| Previous Owner | K & K Construction And Development Inc | $220,000 |
Source: Public Records
Tax History Compared to Growth
Tax History
| Year | Tax Paid | Tax Assessment Tax Assessment Total Assessment is a certain percentage of the fair market value that is determined by local assessors to be the total taxable value of land and additions on the property. | Land | Improvement |
|---|---|---|---|---|
| 2025 | $1,931 | $291,775 | $74,250 | $217,525 |
| 2023 | $2,018 | $301,510 | $52,250 | $249,260 |
| 2022 | $2,351 | $330,275 | $52,250 | $278,025 |
| 2021 | $2,034 | $426,100 | $80,000 | $346,100 |
| 2020 | $1,816 | $358,300 | $75,000 | $283,300 |
| 2019 | $1,728 | $333,100 | $60,000 | $273,100 |
| 2018 | $1,694 | $168,630 | $0 | $0 |
| 2017 | $1,889 | $182,600 | $0 | $0 |
| 2016 | $1,964 | $175,505 | $0 | $0 |
| 2015 | $3,318 | $284,500 | $0 | $0 |
| 2014 | $1,663 | $143,500 | $0 | $0 |
Source: Public Records
Map
Nearby Homes
- 2843 E 410 St N
- 2801 E 450 N Unit 324
- 2801 E 450 N Unit 329
- 435 N 2830 E
- 2713 E 430 N
- 2930 E 450 N Unit F6
- 2675 E 450 N Unit 19
- 2675 E 450 N Unit 2
- 600 N 2450 E Unit 1004
- 600 N 2450 E Unit 1003
- 600 N 2450 E Unit 1001
- 233 N 2830 E
- 2720 N 2720 E
- 646 N 2450 E Unit 17
- 491 N 2480 E
- 240 N Sunflower Dr
- 240 N Sunflower Dr Unit 42
- 790 N 2720 E Unit 24
- 345 N 2450 E Unit 120
- 345 N 2450 E