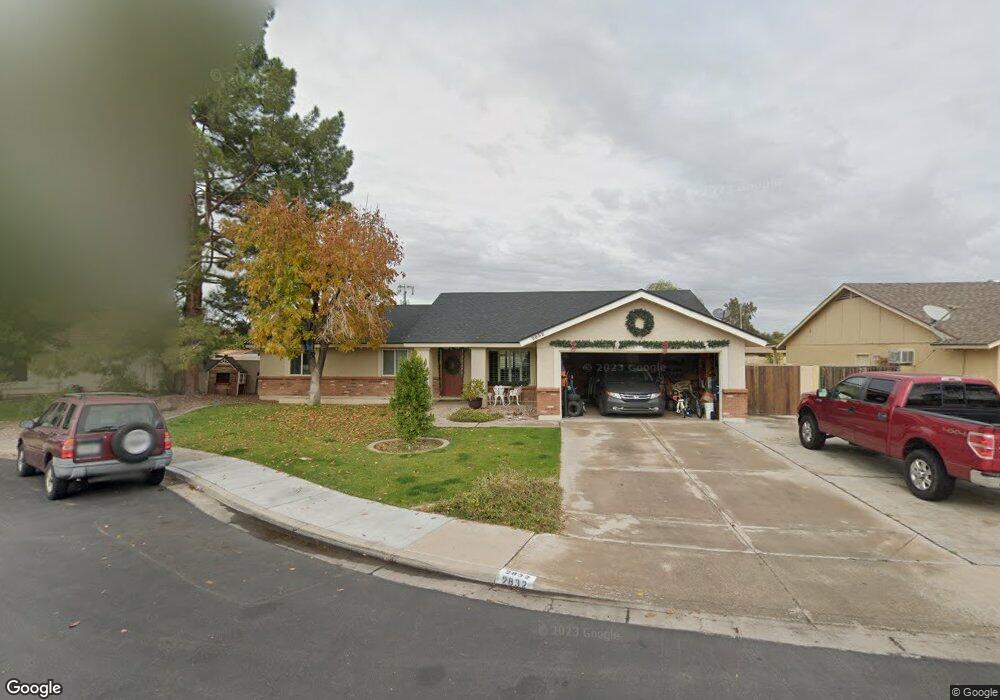
2832 E Downing Cir Mesa, AZ 85213
The Groves NeighborhoodEstimated Value: $482,954 - $574,000
Studio
3
Baths
1,634
Sq Ft
$328/Sq Ft
Est. Value
About This Home
This home is located at 2832 E Downing Cir, Mesa, AZ 85213 and is currently estimated at $535,489, approximately $327 per square foot. 2832 E Downing Cir is a home located in Maricopa County with nearby schools including Highland Elementary School, Franklin at Brimhall Elementary School, and Franklin West Elementary School.
Ownership History
Date
Name
Owned For
Owner Type
Purchase Details
Closed on
Jan 5, 2021
Sold by
Brinson Michael J and Brinson Amber L
Bought by
Brinson Michael J and Brinson Amber L
Current Estimated Value
Purchase Details
Closed on
Jan 4, 2017
Sold by
Woffinden Scott and Woffinden Janae
Bought by
Woffinden Scott J and Woffinden Janae A
Purchase Details
Closed on
Nov 1, 2014
Sold by
Woffinden C Brent and Woffinden Pamela H
Bought by
Woffinden Scott and Woffinden Janae
Home Financials for this Owner
Home Financials are based on the most recent Mortgage that was taken out on this home.
Original Mortgage
$217,677
Interest Rate
4.2%
Mortgage Type
Seller Take Back
Purchase Details
Closed on
Jun 11, 2001
Sold by
Woffinden C Brent and Woffinden Pamela H
Bought by
Woffinden C Brent and Woffinden Pamela H
Create a Home Valuation Report for This Property
The Home Valuation Report is an in-depth analysis detailing your home's value as well as a comparison with similar homes in the area
Home Values in the Area
Average Home Value in this Area
Purchase History
| Date | Buyer | Sale Price | Title Company |
|---|---|---|---|
| Brinson Michael J | -- | None Available | |
| Woffinden Scott J | -- | None Available | |
| Woffinden Scott | $217,677 | None Available | |
| Woffinden C Brent | -- | -- |
Source: Public Records
Mortgage History
| Date | Status | Borrower | Loan Amount |
|---|---|---|---|
| Previous Owner | Woffinden Scott | $217,677 |
Source: Public Records
Tax History
| Year | Tax Paid | Tax Assessment Tax Assessment Total Assessment is a certain percentage of the fair market value that is determined by local assessors to be the total taxable value of land and additions on the property. | Land | Improvement |
|---|---|---|---|---|
| 2025 | $1,664 | $20,037 | -- | -- |
| 2024 | $1,682 | $19,083 | -- | -- |
| 2023 | $1,682 | $38,080 | $7,610 | $30,470 |
| 2022 | $1,645 | $28,580 | $5,710 | $22,870 |
| 2021 | $1,690 | $27,330 | $5,460 | $21,870 |
| 2020 | $1,668 | $25,170 | $5,030 | $20,140 |
| 2019 | $1,545 | $23,110 | $4,620 | $18,490 |
| 2018 | $1,475 | $21,380 | $4,270 | $17,110 |
| 2017 | $1,429 | $19,950 | $3,990 | $15,960 |
| 2016 | $1,403 | $19,720 | $3,940 | $15,780 |
| 2015 | $1,325 | $18,870 | $3,770 | $15,100 |
Source: Public Records
Map
Nearby Homes
- 824 N York Cir
- 2655 E Encanto St
- 721 N 25th St
- 3050 E Cicero St
- 2842 E Fox St
- 3228 E Dover St
- 1111 N Alba Cir
- 2435 E Evergreen St
- 432 N Whiting
- 3160 E Enrose St
- 3203 E Ellis St
- 2511 E Fountain St
- 2458 E University Dr Unit 2
- 3020 E Main St Unit G97
- 3020 E Main St Unit I-52
- 3020 E Main St Unit T82
- 2848 E Brown Rd Unit 7
- 2416 E University Dr Unit 4
- 2322 E Evergreen St
- 2301 E Enrose St
- 2838 E Downing Cir
- 2846 E Downing Cir
- 2831 E Adobe St
- 2826 E Downing Cir
- 2837 E Adobe St
- 2827 E Adobe St
- 2820 E Downing Cir
- 2833 E Downing Cir
- 2844 E Downing Cir
- 2843 E Adobe St
- 2827 E Downing Cir
- 2839 E Downing Cir
- 2845 E Downing Cir
- 2849 E Adobe St
- 2850 E Downing Cir
- 2838 E Dartmouth St
- 2846 E Dartmouth St
- 759 N Lindsay Rd
- 2830 E Dartmouth St
- 2854 E Dartmouth St
Your Personal Tour Guide
Ask me questions while you tour the home.