Estimated Value: $291,000 - $401,000
3
Beds
2
Baths
2,173
Sq Ft
$151/Sq Ft
Est. Value
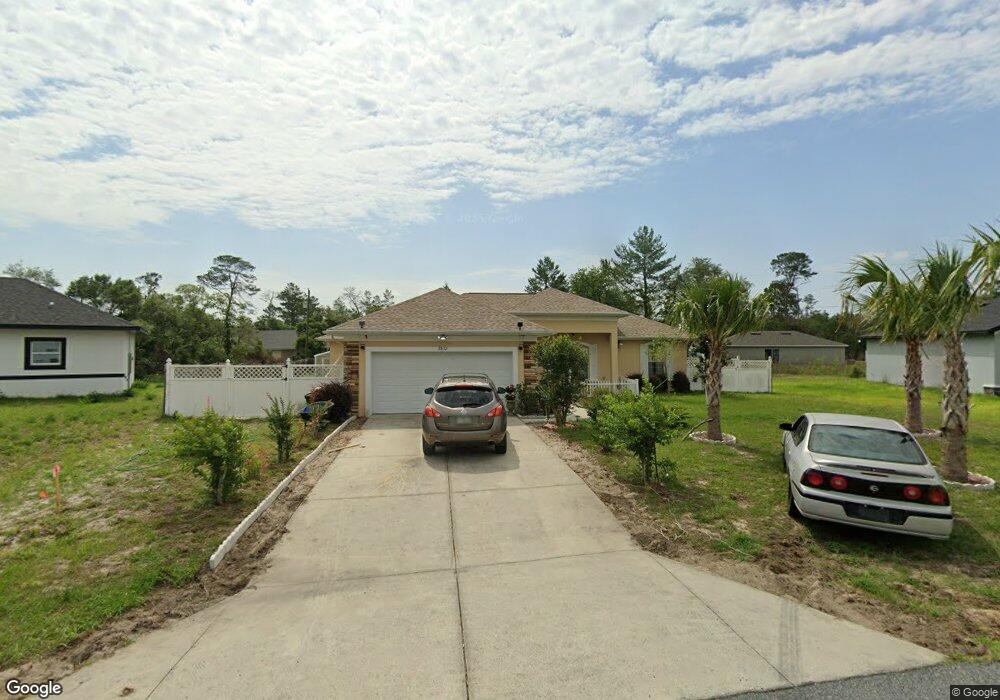
About This Home
This home is located at 2832 SW 166th Ln, Ocala, FL 34473 and is currently estimated at $327,318, approximately $150 per square foot. 2832 SW 166th Ln is a home located in Marion County with nearby schools including Marion Oaks Elementary School, Horizon Academy At Marion Oaks, and Dunnellon High School.
Ownership History
Date
Name
Owned For
Owner Type
Purchase Details
Closed on
Dec 28, 2022
Sold by
Deneus-Vilcant Hellande
Bought by
Vilcant Ulbert
Current Estimated Value
Purchase Details
Closed on
Jul 22, 2022
Sold by
Vilcant and Louicilia
Bought by
Deneus-Vilcant Hellande
Purchase Details
Closed on
Dec 14, 2007
Sold by
Tieche Steven C
Bought by
Vilcant Ulbert and Vilcant Louicilia
Home Financials for this Owner
Home Financials are based on the most recent Mortgage that was taken out on this home.
Original Mortgage
$111,000
Interest Rate
6.22%
Mortgage Type
Purchase Money Mortgage
Purchase Details
Closed on
Dec 6, 2006
Sold by
Kravitz David and Kravitz Jacqueline
Bought by
Tieche Steven C
Purchase Details
Closed on
Apr 6, 2005
Sold by
Hayes Perciveranda B and Hayes Edward J
Bought by
Kravitz David and Kravitz Jacqueline
Create a Home Valuation Report for This Property
The Home Valuation Report is an in-depth analysis detailing your home's value as well as a comparison with similar homes in the area
Home Values in the Area
Average Home Value in this Area
Purchase History
| Date | Buyer | Sale Price | Title Company |
|---|---|---|---|
| Vilcant Ulbert | $100 | -- | |
| Deneus-Vilcant Hellande | -- | Wilson & Williams Pa | |
| Vilcant Ulbert | $185,000 | First American Title Ins Co | |
| Tieche Steven C | $27,900 | Security Title Of Indian Riv | |
| Kravitz David | $22,500 | Security Title Of Indian Riv |
Source: Public Records
Mortgage History
| Date | Status | Borrower | Loan Amount |
|---|---|---|---|
| Previous Owner | Vilcant Ulbert | $111,000 |
Source: Public Records
Tax History
| Year | Tax Paid | Tax Assessment Tax Assessment Total Assessment is a certain percentage of the fair market value that is determined by local assessors to be the total taxable value of land and additions on the property. | Land | Improvement |
|---|---|---|---|---|
| 2025 | $4,646 | $291,731 | $34,200 | $257,531 |
| 2024 | $4,623 | $293,681 | -- | -- |
| 2023 | $4,650 | $293,205 | $21,250 | $271,955 |
| 2022 | $4,731 | $298,137 | $16,000 | $282,137 |
| 2021 | $3,848 | $202,742 | $6,375 | $196,367 |
| 2020 | $3,516 | $178,551 | $7,300 | $171,251 |
| 2019 | $3,376 | $171,648 | $4,700 | $166,948 |
| 2018 | $3,068 | $164,978 | $4,100 | $160,878 |
| 2017 | $2,742 | $137,931 | $3,200 | $134,731 |
| 2016 | $2,466 | $121,044 | $0 | $0 |
| 2015 | $2,351 | $110,040 | $0 | $0 |
| 2014 | $2,036 | $100,036 | $0 | $0 |
Source: Public Records
Map
Nearby Homes
- 2844 SW 164th Street Rd
- TBD SW 164th Street Rd
- 2645 SW 163rd Place
- 2673 SW 165th Street Rd
- 2674 SW 165th Street Rd
- 16600 SW 23rd Avenue Rd
- 2517 SW 165th Street Rd
- 16863 SW 29th Terrace Rd
- 16428 SW 27th Ave
- 16417 SW 27th Cir
- 2518 SW 165th Street Rd
- 15243 SW 29th Terrace Rd
- 16856 SW 29th Terrace Rd
- 16910 SW 27 Ave
- 15349 SW 29th Terrace Rd
- 16855 SW 25th Ct
- 16820 SW 29th Terrace Rd
- 2454 SW 167th Loop
- 2875 SW 162nd Street Rd
- 0 SW 167th Loop Unit A11919008
- 2733 SW 172nd Lane Rd
- 2717 SW 172nd Lane Rd
- 2781 SW 172nd Lane Rd
- TBD SW 172nd Lane Rd
- 2765 SW 172nd Lane Rd
- 2856 SW 166th Ln
- 2764 SW 172nd Lane Rd
- 16672 SW 22nd Terrace Rd
- 2855 SW 166th Ln
- 2856 SW 166th Ln
- 2838 SW 164th Street Rd
- 2732 SW 172nd Lane Rd
- 2864 SW 166th Ln
- 2797 SW 172nd Lane Rd
- 2722 SW 172nd Lane Rd
- 2806 SW 166th Ln
- SW 172nd Lane Rd
- 2872 SW 166th Ln
- 2848 SW 166th Ln
- 2817 SW 172nd Lane Rd
Your Personal Tour Guide
Ask me questions while you tour the home.