2832 SW 26th Ave Unit 40 Cape Coral, FL 33914
Pelican NeighborhoodEstimated Value: $466,000 - $634,305
3
Beds
2
Baths
3,246
Sq Ft
$169/Sq Ft
Est. Value
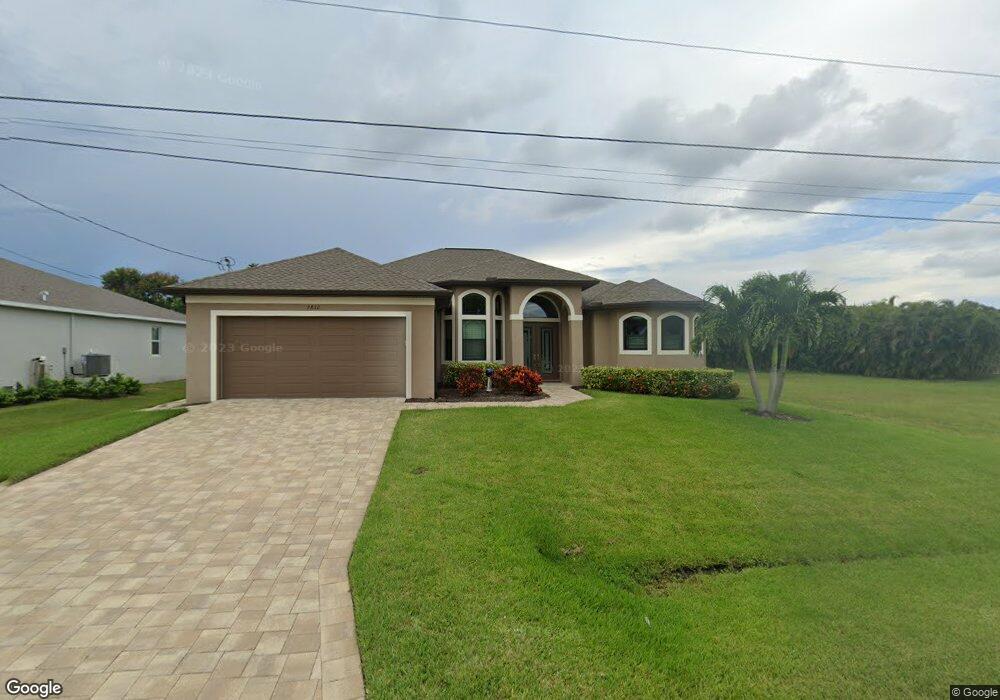
About This Home
This home is located at 2832 SW 26th Ave Unit 40, Cape Coral, FL 33914 and is currently estimated at $549,576, approximately $169 per square foot. 2832 SW 26th Ave Unit 40 is a home located in Lee County with nearby schools including Cape Elementary School, Caloosa Elementary School, and Tropic Isles Elementary School.
Ownership History
Date
Name
Owned For
Owner Type
Purchase Details
Closed on
Jan 22, 2025
Sold by
Renzenberger Lynne Christine
Bought by
Suglem Cindy
Current Estimated Value
Purchase Details
Closed on
Dec 2, 2024
Sold by
Sinclair Douglas M
Bought by
Renzenberger Lynne Christine
Purchase Details
Closed on
May 9, 2016
Sold by
Mendez Luis and Mendez Massy
Bought by
Sinclair Douglas M and Sinclair Barbara T
Purchase Details
Closed on
Mar 11, 2004
Sold by
D & M Chrysler Jeep Inc
Bought by
Mendez Luis and Mendez Massy
Home Financials for this Owner
Home Financials are based on the most recent Mortgage that was taken out on this home.
Original Mortgage
$28,800
Interest Rate
5.72%
Mortgage Type
Unknown
Create a Home Valuation Report for This Property
The Home Valuation Report is an in-depth analysis detailing your home's value as well as a comparison with similar homes in the area
Home Values in the Area
Average Home Value in this Area
Purchase History
| Date | Buyer | Sale Price | Title Company |
|---|---|---|---|
| Suglem Cindy | $100 | None Listed On Document | |
| Suglem Cindy | $100 | None Listed On Document | |
| Renzenberger Lynne Christine | $500,000 | Sandbar Title | |
| Renzenberger Lynne Christine | $500,000 | Sandbar Title | |
| Sinclair Douglas M | $39,000 | Title Specialists Of The Gul | |
| Mendez Luis | $28,857 | Bay Title Services |
Source: Public Records
Mortgage History
| Date | Status | Borrower | Loan Amount |
|---|---|---|---|
| Previous Owner | Mendez Luis | $28,800 |
Source: Public Records
Tax History Compared to Growth
Tax History
| Year | Tax Paid | Tax Assessment Tax Assessment Total Assessment is a certain percentage of the fair market value that is determined by local assessors to be the total taxable value of land and additions on the property. | Land | Improvement |
|---|---|---|---|---|
| 2025 | $10,824 | $653,782 | $88,825 | $513,725 |
| 2024 | $10,824 | $502,480 | -- | -- |
| 2023 | $10,033 | $456,800 | $0 | $0 |
| 2022 | $8,985 | $415,273 | $0 | $0 |
| 2021 | $8,186 | $378,729 | $37,000 | $341,729 |
| 2020 | $7,698 | $343,201 | $33,600 | $309,601 |
| 2019 | $7,253 | $320,586 | $33,600 | $286,986 |
| 2018 | $1,660 | $32,000 | $32,000 | $0 |
| 2017 | $1,615 | $29,151 | $29,151 | $0 |
| 2016 | $1,457 | $24,000 | $24,000 | $0 |
| 2015 | $1,402 | $20,600 | $20,600 | $0 |
| 2014 | -- | $18,600 | $18,600 | $0 |
| 2013 | -- | $9,100 | $9,100 | $0 |
Source: Public Records
Map
Nearby Homes
- 2835 SW 26th Place
- 2625 SW 28th Terrace
- 2535 SW 30th St
- 2616 SW 27th St
- 2711 SW 27th St
- 2810 Surfside Blvd
- 2834 SW 25th Place
- 2734 SW 28th Ave
- 2829 SW 25th Place
- 2592 Surfside Blvd
- 2849 SW 25th Place
- 2569 SW 27th Ave
- 2729 SW 28th Place
- 3027 SW 26th Ct
- 2725 SW 28th Place
- 2911 SW 25th Place
- 2563 SW 27th Ave
- 2713 SW 28th Ave
- 2579 Surfside Blvd
- 3101 SW 26th Place
- 2836 SW 26th Ave
- 2831 SW 26th Place
- 2820 SW 26th Ave Unit 93
- 2840 SW 26th Ave
- 2839 SW 26th Place
- 2833 SW 26th Ave
- 2833 SW 26th Ave Unit 4
- 2821 SW 26th Place
- 2829 SW 26th Ave
- 2837 SW 26th Ave
- 2843 SW 26th Place
- 2844 SW 26th Ave
- 2821 SW 26th Ave Unit 1
- 2841 SW 26th Ave Unit 93
- 2828 SW 26th Place
- 2549 SW 29th Terrace
- 2832 SW 26th Place
- 2828 SW 26 Place
- 2847 SW 26th Place
- 2641 SW 28th Terrace