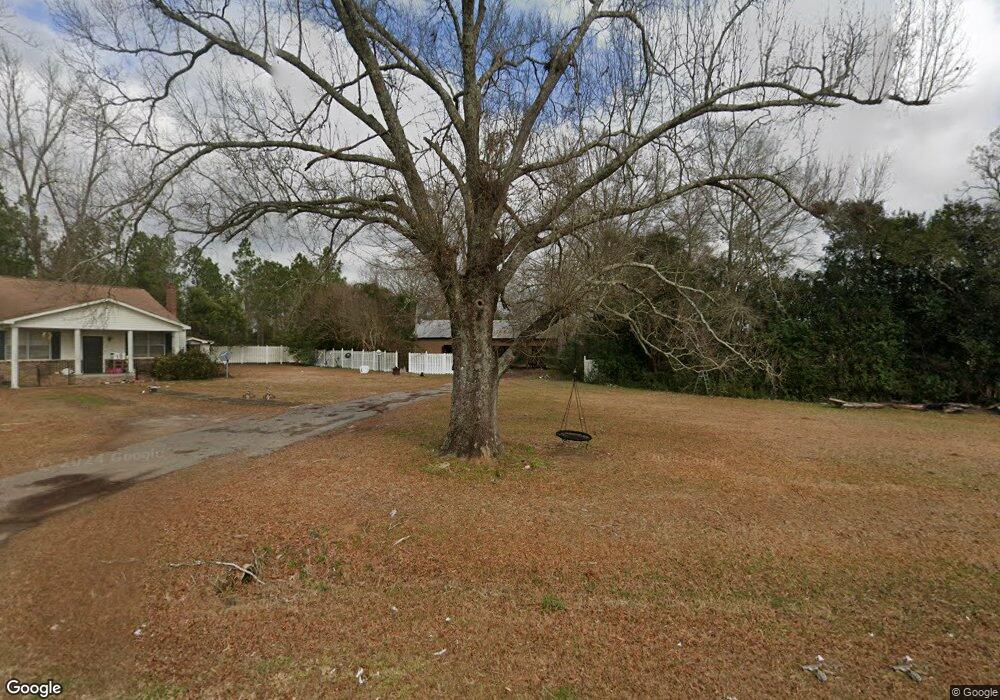
28326 Ga Highway 39 Blakely, GA 39823
Estimated Value: $142,108 - $178,000
--
Bed
2
Baths
1,974
Sq Ft
$82/Sq Ft
Est. Value
About This Home
This home is located at 28326 Ga Highway 39, Blakely, GA 39823 and is currently estimated at $162,527, approximately $82 per square foot. 28326 Ga Highway 39 is a home located in Early County with nearby schools including Early County Elementary School, Early County Middle School, and Early County High School.
Ownership History
Date
Name
Owned For
Owner Type
Purchase Details
Closed on
Feb 9, 2017
Sold by
Brown Mary Hazel C
Bought by
Jenkins Jessica Charlene
Current Estimated Value
Home Financials for this Owner
Home Financials are based on the most recent Mortgage that was taken out on this home.
Original Mortgage
$80,939
Interest Rate
4.12%
Mortgage Type
New Conventional
Purchase Details
Closed on
Sep 4, 2008
Sold by
Brown Mary Hazel C
Bought by
Reed Madline B
Purchase Details
Closed on
Aug 27, 2008
Sold by
Brown Mary Hazel C
Bought by
Rbown Mary Hazel C and Brown Harvey O
Purchase Details
Closed on
Mar 14, 1984
Sold by
Brown Harvey O
Bought by
Fleming William and Fleming Judy
Purchase Details
Closed on
Aug 25, 1948
Sold by
Loyless J G
Bought by
Brown Harvey O
Create a Home Valuation Report for This Property
The Home Valuation Report is an in-depth analysis detailing your home's value as well as a comparison with similar homes in the area
Home Values in the Area
Average Home Value in this Area
Purchase History
| Date | Buyer | Sale Price | Title Company |
|---|---|---|---|
| Jenkins Jessica Charlene | $87,500 | -- | |
| Reed Madline B | -- | -- | |
| Fleming William W | -- | -- | |
| Pryer Carol B | -- | -- | |
| Rbown Mary Hazel C | -- | -- | |
| Fleming William | -- | -- | |
| Brown Harvey O | -- | -- |
Source: Public Records
Mortgage History
| Date | Status | Borrower | Loan Amount |
|---|---|---|---|
| Closed | Jenkins Jessica Charlene | $80,939 |
Source: Public Records
Tax History Compared to Growth
Tax History
| Year | Tax Paid | Tax Assessment Tax Assessment Total Assessment is a certain percentage of the fair market value that is determined by local assessors to be the total taxable value of land and additions on the property. | Land | Improvement |
|---|---|---|---|---|
| 2024 | $1,081 | $40,150 | $5,068 | $35,082 |
| 2023 | $1,022 | $40,150 | $5,068 | $35,082 |
| 2022 | $961 | $38,101 | $3,677 | $34,424 |
| 2021 | $850 | $33,377 | $3,677 | $29,700 |
| 2020 | $834 | $33,377 | $3,677 | $29,700 |
| 2019 | $862 | $33,517 | $3,677 | $29,840 |
| 2018 | $897 | $34,869 | $3,677 | $31,192 |
| 2017 | $762 | $37,250 | $3,677 | $33,573 |
| 2016 | $722 | $34,788 | $3,677 | $31,111 |
| 2015 | -- | $35,279 | $3,183 | $32,096 |
| 2014 | -- | $35,280 | $3,183 | $32,096 |
| 2013 | -- | $35,768 | $3,183 | $32,585 |
Source: Public Records
Map
Nearby Homes
- 1412 Clark Rd
- 507 Js McLeod Jr Way
- Grimsley Mill Rd
- 507 Lakewood Dr
- 16 Woodlawn Dr
- 00 N Woodlawn Dr
- 115 S Central Ave
- 1827 Tarver Dr
- 4497 Simmons Dairy Rd
- 0000 Martin Luther King Junior Blvd
- 21 E Railroad Ln
- 234 College St
- 337 College St
- 73 Grove Place
- 11401 Columbia St
- 8 Lots Unknown Ln
- 73 W Westward Ave
- 76 S Jefferson Ave
- 556 Flowers Dr
- 000 Georgia 62