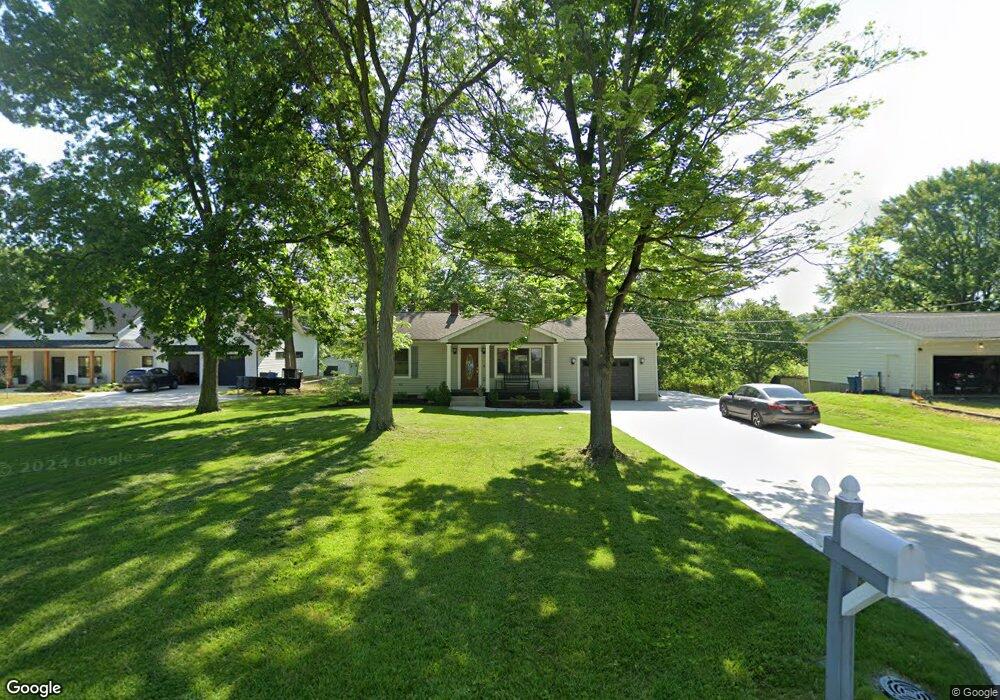
2833 Carillon Dr Norton, OH 44203
Estimated Value: $161,000 - $204,000
2
Beds
1
Bath
768
Sq Ft
$241/Sq Ft
Est. Value
About This Home
This home is located at 2833 Carillon Dr, Norton, OH 44203 and is currently estimated at $185,429, approximately $241 per square foot. 2833 Carillon Dr is a home located in Summit County with nearby schools including Norton Primary Elementary School, Norton Middle School, and Norton High School.
Ownership History
Date
Name
Owned For
Owner Type
Purchase Details
Closed on
Dec 15, 2020
Sold by
Patterson Dustin L
Bought by
Patterson Dustin L
Current Estimated Value
Home Financials for this Owner
Home Financials are based on the most recent Mortgage that was taken out on this home.
Original Mortgage
$125,000
Outstanding Balance
$89,970
Interest Rate
2.3%
Mortgage Type
New Conventional
Estimated Equity
$95,459
Purchase Details
Closed on
Jun 29, 2007
Sold by
Patterson Julie M
Bought by
Patterson Dustin L
Purchase Details
Closed on
Jan 11, 2000
Sold by
Pierro Mary Patricia
Bought by
Patterson Dustin L and Patterson Julie M
Home Financials for this Owner
Home Financials are based on the most recent Mortgage that was taken out on this home.
Original Mortgage
$57,950
Interest Rate
7.84%
Mortgage Type
Purchase Money Mortgage
Create a Home Valuation Report for This Property
The Home Valuation Report is an in-depth analysis detailing your home's value as well as a comparison with similar homes in the area
Home Values in the Area
Average Home Value in this Area
Purchase History
| Date | Buyer | Sale Price | Title Company |
|---|---|---|---|
| Patterson Dustin L | $125,000 | First American Title | |
| Patterson Dustin L | -- | None Available | |
| Patterson Dustin L | -- | Revere Title Summit County | |
| Patterson Dustin L | -- | Title One Agency Inc | |
| Patterson Dustin L | $61,000 | Title One Agency Inc |
Source: Public Records
Mortgage History
| Date | Status | Borrower | Loan Amount |
|---|---|---|---|
| Open | Patterson Dustin L | $125,000 | |
| Previous Owner | Patterson Dustin L | $57,950 |
Source: Public Records
Tax History Compared to Growth
Tax History
| Year | Tax Paid | Tax Assessment Tax Assessment Total Assessment is a certain percentage of the fair market value that is determined by local assessors to be the total taxable value of land and additions on the property. | Land | Improvement |
|---|---|---|---|---|
| 2025 | $2,041 | $49,858 | $12,705 | $37,153 |
| 2024 | $2,041 | $49,858 | $12,705 | $37,153 |
| 2023 | $2,041 | $49,858 | $12,705 | $37,153 |
| 2022 | $1,462 | $29,327 | $7,473 | $21,854 |
| 2021 | $1,469 | $29,327 | $7,473 | $21,854 |
| 2020 | $1,372 | $29,320 | $7,470 | $21,850 |
| 2019 | $1,275 | $23,950 | $7,470 | $16,480 |
| 2018 | $1,254 | $23,950 | $7,470 | $16,480 |
| 2017 | $1,329 | $23,950 | $7,470 | $16,480 |
| 2016 | $1,329 | $23,260 | $7,470 | $15,790 |
| 2015 | $1,329 | $23,260 | $7,470 | $15,790 |
| 2014 | $1,317 | $23,260 | $7,470 | $15,790 |
| 2013 | $1,350 | $24,090 | $7,470 | $16,620 |
Source: Public Records
Map
Nearby Homes
- 2881 Wilbanks Dr
- 2995 Wilbanks Dr
- 3007 Wilbanks Dr
- 2817 Kay Blvd
- 2065 Wadsworth Rd
- 2395 Hull Dr
- 2711 S Cleveland Massillon Rd
- 2394 Jacoby Rd
- 3270 Glenbrook Dr
- 3303 Glenbrook Dr
- 3141 Fair Oaks Dr
- 2982 Fair Oaks Dr
- 2783 Shellhart Rd
- 2767 Steeb Cir
- 2515 Wright Rd
- 3658 Knecht Rd
- 3649 Stradley Cir
- 2902 S/L 16 Willow Way
- 2870 S/L 12 Willow Way
- 3012 Shellhart Rd
- 2817 Carillon Dr
- 2837 Carillon Dr
- 2807 Carillon Dr
- 2847 Carillon Dr
- 2828 Carillon Dr
- 2818 Carillon Dr
- 2838 Carillon Dr
- 2848 Carillon Dr
- 2857 Carillon Dr
- 2797 Carillon Dr
- 2561 Wadsworth Rd
- 2808 Carillon Dr
- 2868 Carillon Dr
- 2798 Carillon Dr
- 2867 Carillon Dr
- 2546 Reimer Road Extension
- 2878 Carillon Dr
- 2555 Wadsworth Rd
- 2587 Reimer Road Extension
- 2557 Reimer Road Extension