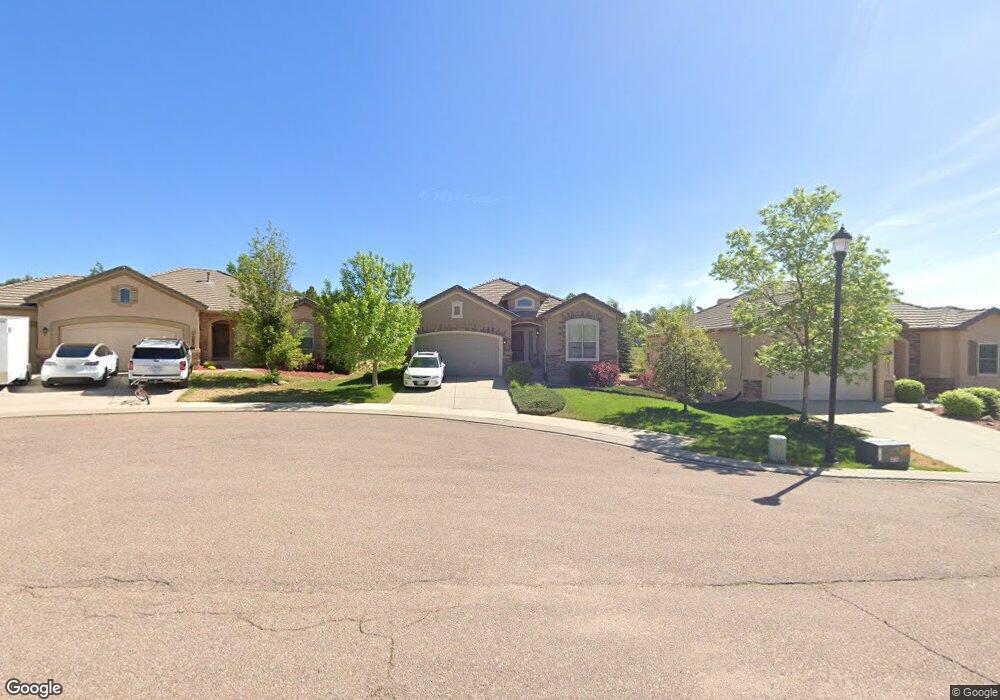
2833 Cinnabar Rd Colorado Springs, CO 80921
Flying Horse Ranch NeighborhoodEstimated Value: $613,724 - $718,000
4
Beds
3
Baths
1,563
Sq Ft
$438/Sq Ft
Est. Value
About This Home
This home is located at 2833 Cinnabar Rd, Colorado Springs, CO 80921 and is currently estimated at $684,431, approximately $437 per square foot. 2833 Cinnabar Rd is a home located in El Paso County with nearby schools including Discovery Canyon Campus Elementary School, Discovery Canyon Campus Middle School, and Discovery Canyon Campus High School.
Ownership History
Date
Name
Owned For
Owner Type
Purchase Details
Closed on
Dec 9, 2010
Sold by
Emc Investments Llc
Bought by
Pilbrow Holly A and Cooke Edward M
Current Estimated Value
Home Financials for this Owner
Home Financials are based on the most recent Mortgage that was taken out on this home.
Original Mortgage
$243,750
Outstanding Balance
$161,205
Interest Rate
4.24%
Mortgage Type
New Conventional
Estimated Equity
$523,226
Purchase Details
Closed on
Nov 2, 2007
Sold by
U S Bank Na
Bought by
Emc Investments Llc
Purchase Details
Closed on
Jan 22, 2007
Sold by
Euro Financial Services Llc
Bought by
Rojas Martha
Purchase Details
Closed on
Nov 12, 2006
Sold by
Rojas Martha
Bought by
Euro Financial Services Llc
Purchase Details
Closed on
Jun 12, 2006
Sold by
Elite Properties Of America Inc
Bought by
Rojas Martha
Home Financials for this Owner
Home Financials are based on the most recent Mortgage that was taken out on this home.
Original Mortgage
$300,742
Interest Rate
6.58%
Mortgage Type
Fannie Mae Freddie Mac
Create a Home Valuation Report for This Property
The Home Valuation Report is an in-depth analysis detailing your home's value as well as a comparison with similar homes in the area
Home Values in the Area
Average Home Value in this Area
Purchase History
| Date | Buyer | Sale Price | Title Company |
|---|---|---|---|
| Pilbrow Holly A | -- | Bankers Title | |
| Emc Investments Llc | $321,000 | Security Title | |
| Rojas Martha | -- | None Available | |
| Euro Financial Services Llc | -- | None Available | |
| Rojas Martha | $375,928 | -- |
Source: Public Records
Mortgage History
| Date | Status | Borrower | Loan Amount |
|---|---|---|---|
| Open | Pilbrow Holly A | $243,750 | |
| Previous Owner | Rojas Martha | $300,742 |
Source: Public Records
Tax History Compared to Growth
Tax History
| Year | Tax Paid | Tax Assessment Tax Assessment Total Assessment is a certain percentage of the fair market value that is determined by local assessors to be the total taxable value of land and additions on the property. | Land | Improvement |
|---|---|---|---|---|
| 2025 | $4,161 | $45,110 | -- | -- |
| 2024 | $4,034 | $41,640 | $9,580 | $32,060 |
| 2022 | $3,457 | $30,950 | $9,040 | $21,910 |
| 2021 | $3,693 | $31,840 | $9,300 | $22,540 |
| 2020 | $3,648 | $30,240 | $9,300 | $20,940 |
| 2019 | $3,623 | $30,240 | $9,300 | $20,940 |
| 2018 | $3,282 | $27,180 | $7,490 | $19,690 |
| 2017 | $3,464 | $27,180 | $7,490 | $19,690 |
| 2016 | $3,195 | $26,780 | $7,240 | $19,540 |
| 2015 | $3,191 | $26,780 | $7,240 | $19,540 |
| 2014 | $2,929 | $24,570 | $7,240 | $17,330 |
Source: Public Records
Map
Nearby Homes
- 2553 Cinnabar Rd
- 2374 Cinnabar Rd
- 2351 Limerick Ct
- 13625 Random Ridge View
- 13525 Random Ridge View
- 14535 Roller Coaster Rd
- 13632 Stony Hill Point
- 2550 Mountain Pine Ln
- 13654 Fife Ct
- 2180 Rocking Horse Ct
- 13274 Cake Bread Heights
- 1818 Redbank Dr
- 13114 Cake Bread Heights
- 13901 Penfold Dr
- 12810 Abert Way
- 12988 Cupcake Heights
- 12950 Penfold Dr
- 15030 Roller Coaster Rd
- 13557 Pride Mountain Dr
- Magnolia Plan at Flying Horse - Ranch
- 2823 Cinnabar Rd
- 2843 Cinnabar Rd
- 2810 Crooked Vine Ct
- 2813 Cinnabar Rd
- 2792 Crooked Vine Ct
- 2853 Cinnabar Rd
- 2803 Cinnabar Rd
- 2824 Cinnabar Rd
- 2844 Cinnabar Rd
- 2828 Crooked Vine Ct
- 2834 Cinnabar Rd
- 2804 Cinnabar Rd
- 2775 Crooked Vine Ct
- 2793 Crooked Vine Ct
- 2847 Crooked Vine Ct
- 2757 Crooked Vine Ct
- 2811 Crooked Vine Ct
- 2703 Crooked Vine Ct
- 2721 Crooked Vine Ct
- 13255 Honey Run Way