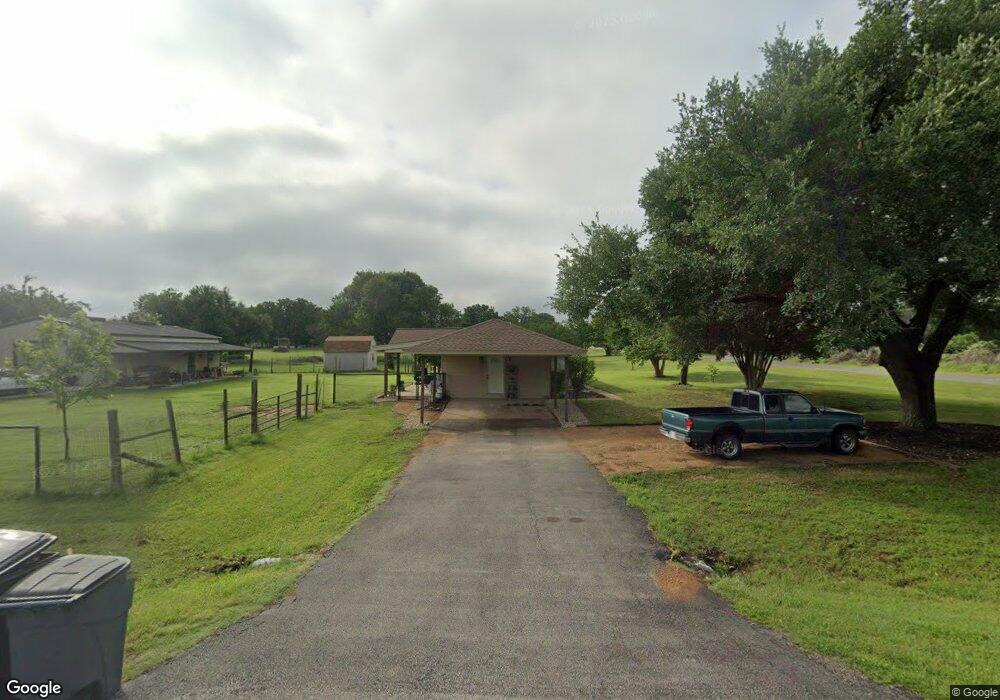
2833 Doss Rd Burleson, TX 76028
Estimated Value: $279,071 - $377,000
3
Beds
2
Baths
1,300
Sq Ft
$239/Sq Ft
Est. Value
About This Home
This home is located at 2833 Doss Rd, Burleson, TX 76028 and is currently estimated at $310,768, approximately $239 per square foot. 2833 Doss Rd is a home located in Johnson County with nearby schools including A.G. Elder Elementary School, Joshua High School, and Joshua High School - 9th Grade Campus.
Ownership History
Date
Name
Owned For
Owner Type
Purchase Details
Closed on
Aug 7, 2015
Sold by
Bernal Juan P
Bought by
Nation Mark William and Nation Teresa D
Current Estimated Value
Home Financials for this Owner
Home Financials are based on the most recent Mortgage that was taken out on this home.
Original Mortgage
$109,600
Outstanding Balance
$86,492
Interest Rate
4.13%
Mortgage Type
New Conventional
Estimated Equity
$224,276
Purchase Details
Closed on
Aug 24, 2006
Sold by
Price Donald and Price Sarah
Bought by
Bernal Juan P
Home Financials for this Owner
Home Financials are based on the most recent Mortgage that was taken out on this home.
Original Mortgage
$108,097
Interest Rate
6.72%
Mortgage Type
FHA
Purchase Details
Closed on
Aug 12, 2005
Sold by
Berry Jim
Bought by
Price Donald and Price Sarah
Home Financials for this Owner
Home Financials are based on the most recent Mortgage that was taken out on this home.
Original Mortgage
$95,400
Interest Rate
5.61%
Mortgage Type
Seller Take Back
Purchase Details
Closed on
Jun 7, 2005
Sold by
Randall Gary L and Randall Sheila A
Bought by
Berry Jim
Create a Home Valuation Report for This Property
The Home Valuation Report is an in-depth analysis detailing your home's value as well as a comparison with similar homes in the area
Home Values in the Area
Average Home Value in this Area
Purchase History
| Date | Buyer | Sale Price | Title Company |
|---|---|---|---|
| Nation Mark William | -- | Providence Title Co | |
| Bernal Juan P | -- | Natc | |
| Price Donald | -- | Natc | |
| Berry Jim | $49,749 | None Available |
Source: Public Records
Mortgage History
| Date | Status | Borrower | Loan Amount |
|---|---|---|---|
| Open | Nation Mark William | $109,600 | |
| Previous Owner | Bernal Juan P | $108,097 | |
| Previous Owner | Price Donald | $95,400 |
Source: Public Records
Tax History Compared to Growth
Tax History
| Year | Tax Paid | Tax Assessment Tax Assessment Total Assessment is a certain percentage of the fair market value that is determined by local assessors to be the total taxable value of land and additions on the property. | Land | Improvement |
|---|---|---|---|---|
| 2025 | $2,398 | $213,004 | $41,325 | $171,679 |
| 2024 | $3,703 | $212,284 | $0 | $0 |
| 2023 | $1,922 | $192,985 | $41,325 | $151,660 |
| 2022 | $3,271 | $181,965 | $30,305 | $151,660 |
| 2021 | $3,312 | $181,965 | $30,305 | $151,660 |
| 2020 | $3,589 | $181,965 | $30,305 | $151,660 |
| 2019 | $4,179 | $198,827 | $30,305 | $168,522 |
| 2018 | $4,044 | $214,705 | $30,305 | $184,400 |
| 2017 | $3,673 | $168,529 | $24,000 | $144,529 |
| 2016 | $3,024 | $138,744 | $20,000 | $118,744 |
| 2015 | $1,904 | $121,336 | $17,000 | $104,336 |
| 2014 | $1,904 | $121,336 | $17,000 | $104,336 |
Source: Public Records
Map
Nearby Homes
- 2736 County Road 804a
- 3101 Collins Rd
- 3175 Collins Rd
- 3345 Collins Rd
- 7480 County Road 802
- 7791 Weatherby Rd
- 2637 Streamside Dr
- 2631 Streamside Dr
- 2629 Streamside Dr
- 2609 Streamside Dr
- 2607 Streamside Dr
- 3225 Fm 731
- 2629 River Bank
- 2629 Riverbank Dr
- 2600 Streamside Dr
- 2673 River Bank Dr
- 1188 Oak Spring Dr
- 1184 Oak Spring Dr
- Hadleigh Plan at Mountain Valley - The Preserve
- Pembridge II Plan at Mountain Valley - The Preserve
- 7712 County Road 804
- 2829 Doss Rd
- 2825 Doss Rd
- 2836 Doss Rd
- 7708 County Road 804
- 2824 Doss Rd
- 2401 Brownstone Dr
- 7801 County Road 804
- 2821 Doss Rd
- 2820 Doss Rd
- 2836 Brookhollow Dr
- 2841 County Road 804a
- 2837 County Road 804a
- 2848 Brookhollow Dr
- 2405 Brownstone Dr
- 2844 Brookhollow Dr
- 2833 County Road 804a
- 2817 Doss Rd
- 7617 County Road 804
- 2832 Brookhollow Dr