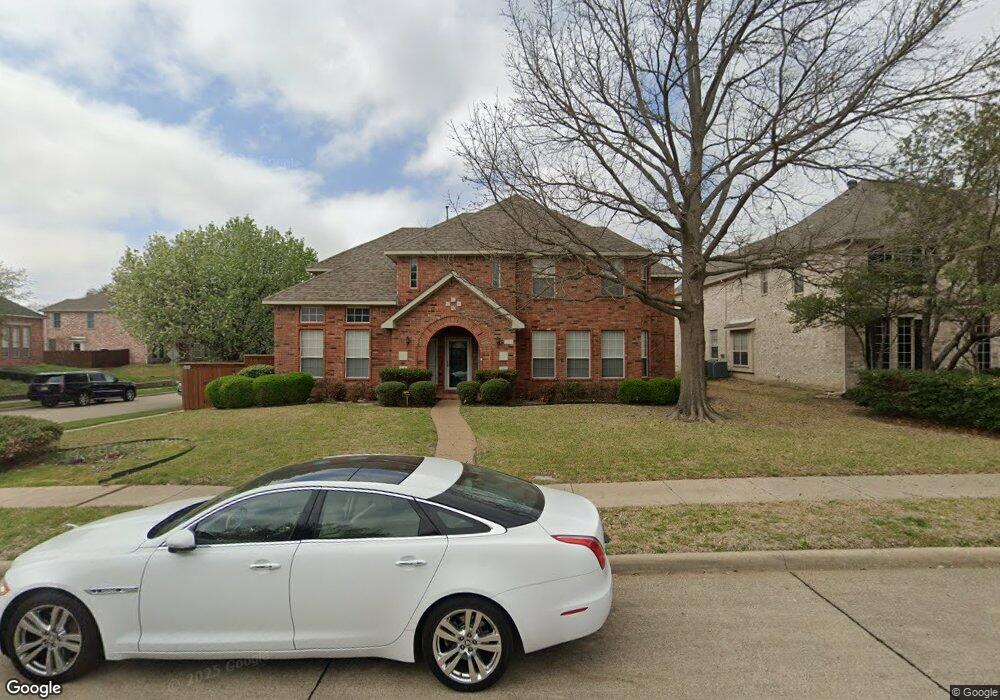
2833 Faversham Dr Richardson, TX 75082
Breckinridge NeighborhoodEstimated Value: $749,000
5
Beds
4
Baths
4,020
Sq Ft
$186/Sq Ft
Est. Value
About This Home
This home is located at 2833 Faversham Dr, Richardson, TX 75082 and is currently estimated at $749,000, approximately $186 per square foot. 2833 Faversham Dr is a home located in Collin County with nearby schools including Miller Elementary School, Murphy Middle School, and C A Mcmillen High School.
Ownership History
Date
Name
Owned For
Owner Type
Purchase Details
Closed on
Aug 16, 2019
Sold by
Op Spe Phxi Llc
Bought by
Northcutt Brian
Current Estimated Value
Home Financials for this Owner
Home Financials are based on the most recent Mortgage that was taken out on this home.
Original Mortgage
$410,875
Outstanding Balance
$359,851
Interest Rate
3.7%
Mortgage Type
New Conventional
Estimated Equity
$389,149
Purchase Details
Closed on
Apr 25, 2019
Sold by
Slater Mark A and Slater Toni D
Bought by
Op Spe Phx1 Llc
Purchase Details
Closed on
Jun 19, 2015
Sold by
Slater Mark A and Slater Toni D
Bought by
The Mark A Slater & Toni D Slater Revoca
Purchase Details
Closed on
Feb 15, 1996
Sold by
Centex Real Estate Corp
Bought by
Slater Mark A and Slater Toni D
Home Financials for this Owner
Home Financials are based on the most recent Mortgage that was taken out on this home.
Original Mortgage
$207,000
Interest Rate
7.01%
Create a Home Valuation Report for This Property
The Home Valuation Report is an in-depth analysis detailing your home's value as well as a comparison with similar homes in the area
Home Values in the Area
Average Home Value in this Area
Purchase History
| Date | Buyer | Sale Price | Title Company |
|---|---|---|---|
| Northcutt Brian | -- | Fatco | |
| Op Spe Phx1 Llc | -- | First American Title Ins Co | |
| The Mark A Slater & Toni D Slater Revoca | -- | None Available | |
| Slater Mark A | -- | -- |
Source: Public Records
Mortgage History
| Date | Status | Borrower | Loan Amount |
|---|---|---|---|
| Open | Northcutt Brian | $410,875 | |
| Previous Owner | Slater Mark A | $207,000 |
Source: Public Records
Tax History Compared to Growth
Tax History
| Year | Tax Paid | Tax Assessment Tax Assessment Total Assessment is a certain percentage of the fair market value that is determined by local assessors to be the total taxable value of land and additions on the property. | Land | Improvement |
|---|---|---|---|---|
| 2025 | $8,931 | $654,391 | $165,000 | $489,391 |
| 2024 | $8,931 | $597,808 | $137,500 | $513,079 |
| 2023 | $8,931 | $543,462 | $137,500 | $497,663 |
| 2022 | $9,598 | $494,056 | $132,000 | $438,121 |
| 2021 | $9,443 | $449,142 | $99,000 | $350,142 |
| 2020 | $9,558 | $430,792 | $88,000 | $342,792 |
| 2019 | $9,852 | $423,546 | $88,000 | $335,546 |
| 2018 | $9,673 | $414,045 | $88,000 | $326,045 |
| 2017 | $8,909 | $381,325 | $77,000 | $304,325 |
| 2016 | $8,311 | $362,395 | $66,000 | $296,395 |
| 2015 | $6,842 | $321,012 | $66,000 | $255,012 |
| 2014 | $6,842 | $301,895 | $0 | $0 |
Source: Public Records
Map
Nearby Homes
- 2988 Hillingdon Dr
- 18 Kilchurn
- 3041 Hillingdon Dr
- 2720 Ranchview Dr
- 5517 Enfield Dr
- 1201 Tralee Ln
- 3203 Grantham Dr
- 2525 E Brand Rd
- 1001 Lochness Ln
- 4821 Ravendale Dr
- 3309 Grantham Dr
- 4804 Appleridge Dr
- 1230 Donegal Ln
- 2325 Chadwick Ln
- 2309 Chadwick Ln
- 403 Pleasant Run
- 502 Yaupon Dr
- 179 Moonlight Dr
- 4608 Winter Park Dr
- 1526 Bonanza Ct
- 2835 Faversham Dr
- 5409 Faversham Dr
- 5412 Faversham Dr
- 2837 Faversham Dr
- 5414 Faversham Dr
- 2832 Faversham Dr
- 5410 Faversham Dr
- 2834 Faversham Dr
- 5407 Faversham Dr
- 5416 Faversham Dr
- 5408 Faversham Dr
- 2836 Faversham Dr
- 2838 Faversham Dr
- 5406 Faversham Dr
- 5410 Lincolnshire Dr
- 5412 Lincolnshire Dr
- 2805 Ashbury Dr
- 2807 Ashbury Dr
- 2834 Lincolnshire Dr
- 2803 Ashbury Dr