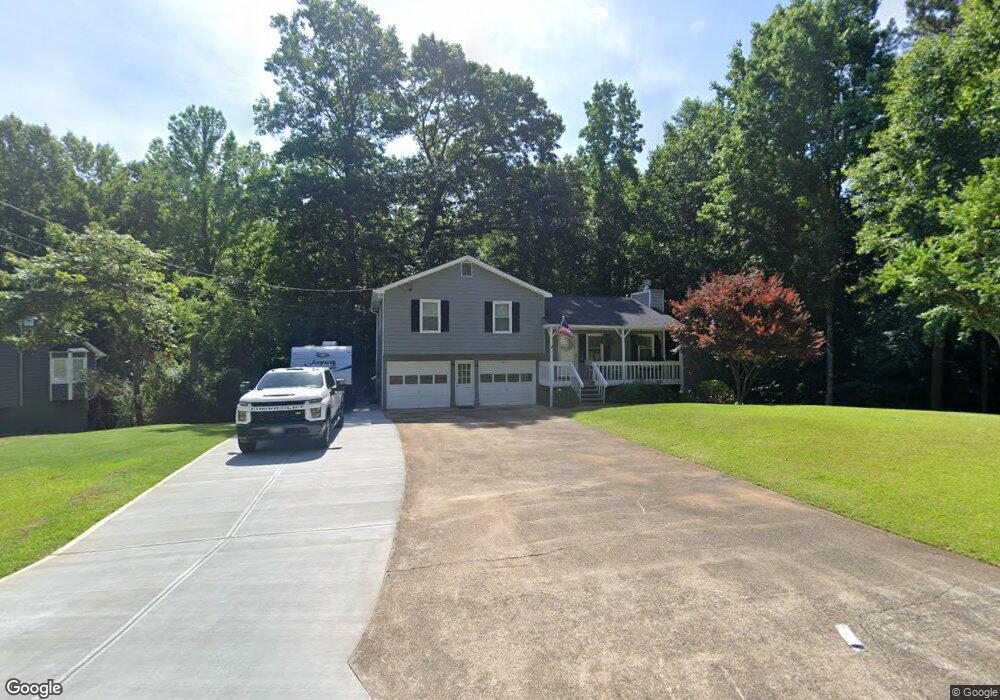
2833 Mountain Brook Rd Unit 1 Canton, GA 30114
Estimated Value: $318,008 - $330,000
3
Beds
2
Baths
1,106
Sq Ft
$293/Sq Ft
Est. Value
About This Home
This home is located at 2833 Mountain Brook Rd Unit 1, Canton, GA 30114 and is currently estimated at $324,004, approximately $292 per square foot. 2833 Mountain Brook Rd Unit 1 is a home located in Cherokee County with nearby schools including Sixes Elementary School, Freedom Middle School, and Woodstock High School.
Ownership History
Date
Name
Owned For
Owner Type
Purchase Details
Closed on
May 23, 2005
Sold by
Knock Christopher
Bought by
Knock Christopher and Knock Kimberly
Current Estimated Value
Home Financials for this Owner
Home Financials are based on the most recent Mortgage that was taken out on this home.
Original Mortgage
$19,500
Outstanding Balance
$5,816
Interest Rate
5.69%
Mortgage Type
New Conventional
Estimated Equity
$318,188
Purchase Details
Closed on
Apr 27, 2004
Sold by
Brown Estelle A
Bought by
Knock Christopher
Home Financials for this Owner
Home Financials are based on the most recent Mortgage that was taken out on this home.
Original Mortgage
$21,953
Interest Rate
5.36%
Mortgage Type
Unknown
Create a Home Valuation Report for This Property
The Home Valuation Report is an in-depth analysis detailing your home's value as well as a comparison with similar homes in the area
Home Values in the Area
Average Home Value in this Area
Purchase History
| Date | Buyer | Sale Price | Title Company |
|---|---|---|---|
| Knock Christopher | -- | -- | |
| Knock Christopher | $109,800 | -- |
Source: Public Records
Mortgage History
| Date | Status | Borrower | Loan Amount |
|---|---|---|---|
| Open | Knock Christopher | $19,500 | |
| Open | Knock Christopher | $104,000 | |
| Previous Owner | Knock Christopher | $21,953 | |
| Previous Owner | Knock Christopher | $87,812 |
Source: Public Records
Tax History Compared to Growth
Tax History
| Year | Tax Paid | Tax Assessment Tax Assessment Total Assessment is a certain percentage of the fair market value that is determined by local assessors to be the total taxable value of land and additions on the property. | Land | Improvement |
|---|---|---|---|---|
| 2025 | $2,593 | $115,288 | $26,000 | $89,288 |
| 2024 | $2,442 | $107,928 | $24,000 | $83,928 |
| 2023 | $1,941 | $104,768 | $24,000 | $80,768 |
| 2022 | $1,983 | $84,968 | $24,000 | $60,968 |
| 2021 | $1,834 | $71,408 | $18,240 | $53,168 |
| 2020 | $1,650 | $63,408 | $16,000 | $47,408 |
| 2019 | $1,497 | $56,800 | $15,200 | $41,600 |
| 2018 | $1,389 | $52,000 | $14,000 | $38,000 |
| 2017 | $1,270 | $116,100 | $12,800 | $33,640 |
| 2016 | $1,151 | $104,600 | $11,200 | $30,640 |
| 2015 | $1,050 | $95,000 | $10,800 | $27,200 |
| 2014 | $759 | $70,200 | $6,000 | $22,080 |
Source: Public Records
Map
Nearby Homes
- 130 Crestmont Dr
- 3161 Marble Quarry Rd
- 346 Wells Cir
- 1415 Sixes Rd
- 1302 Sixes Rd
- 283 Wells Cir
- 279 Wells Cir
- 417 Crestmont Ln
- 206 Sawtooth Ct
- 208 Sawtooth Ct
- 421 Crestmont Ln
- 1000 Rabbit Hill Rd
- 203 Brookhaven Place
- 484 Crestmont Ln
- 251 Manous Way
- 1320 Transart Pkwy
- 104 Kremer Falls Trace
- 104 Kremer Falls Trc
- 2853 Mountain Brook Rd
- 0 Mountain Brook Unit 8751438
- 2840 Mountain Brook Rd
- 0 Mountain Brook Rd Unit LOT 90 3269039
- 0 Mountain Brook Rd Unit LOT 89 3269021
- 0 Mountain Brook Rd Unit 8829709
- 0 Mountain Brook Rd Unit 3166495
- 0 Mountain Brook Rd Unit 7124316
- 0 Mountain Brook Rd Unit 7469805
- 0 Mountain Brook Rd Unit 7491170
- 0 Mountain Brook Rd Unit 7536783
- 0 Mountain Brook Rd Unit 8007379
- 0 Mountain Brook Rd Unit 8042076
- 0 Mountain Brook Rd Unit 8161802
- 0 Mountain Brook Rd Unit 8341972
- 0 Mountain Brook Rd Unit 8387861
- 0 Mountain Brook Rd Unit 8420214
- 0 Mountain Brook Rd Unit 8582066
- 2860 Mountain Brook Rd
- 2813 Mountain Brook Rd