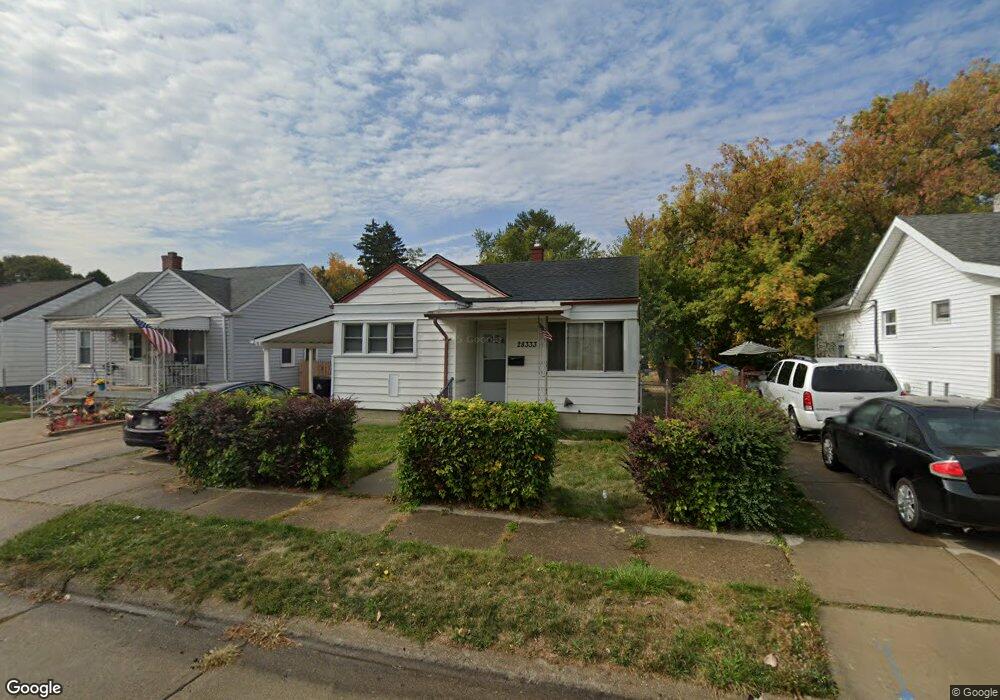
28333 Felician St Roseville, MI 48066
Estimated Value: $128,000 - $147,000
3
Beds
2
Baths
993
Sq Ft
$138/Sq Ft
Est. Value
About This Home
This home is located at 28333 Felician St, Roseville, MI 48066 and is currently estimated at $136,632, approximately $137 per square foot. 28333 Felician St is a home located in Macomb County with nearby schools including Fountain Elementary School, Roseville Middle School, and Eastland Middle School.
Ownership History
Date
Name
Owned For
Owner Type
Purchase Details
Closed on
May 21, 2020
Sold by
Detroit Metro Rental Properties Llc
Bought by
Blake Family Properties Llc
Current Estimated Value
Purchase Details
Closed on
May 26, 2016
Sold by
Ban James and Ban Elisa M
Bought by
Detroit Metro Rental Properties Llc
Purchase Details
Closed on
Aug 5, 2011
Sold by
Flagstar Bank Fsb
Bought by
Secretary Of Housing & Urban Development
Purchase Details
Closed on
Jul 28, 2011
Sold by
Martin Ronald A
Bought by
Flagstar Bank Fsb
Purchase Details
Closed on
Oct 13, 2004
Sold by
Dinoto Martha D and Dinoto Anthony W
Bought by
Martin Ronald A
Home Financials for this Owner
Home Financials are based on the most recent Mortgage that was taken out on this home.
Original Mortgage
$97,727
Interest Rate
5.85%
Mortgage Type
FHA
Create a Home Valuation Report for This Property
The Home Valuation Report is an in-depth analysis detailing your home's value as well as a comparison with similar homes in the area
Home Values in the Area
Average Home Value in this Area
Purchase History
| Date | Buyer | Sale Price | Title Company |
|---|---|---|---|
| Blake Family Properties Llc | $70,000 | None Available | |
| Detroit Metro Rental Properties Llc | -- | None Available | |
| Ban James | $50,500 | Title Connect Llc | |
| Secretary Of Housing & Urban Development | -- | None Available | |
| Flagstar Bank Fsb | $107,195 | None Available | |
| Martin Ronald A | $98,500 | Devon Title Agency |
Source: Public Records
Mortgage History
| Date | Status | Borrower | Loan Amount |
|---|---|---|---|
| Previous Owner | Martin Ronald A | $97,727 |
Source: Public Records
Tax History Compared to Growth
Tax History
| Year | Tax Paid | Tax Assessment Tax Assessment Total Assessment is a certain percentage of the fair market value that is determined by local assessors to be the total taxable value of land and additions on the property. | Land | Improvement |
|---|---|---|---|---|
| 2025 | $3,234 | $67,000 | $0 | $0 |
| 2024 | $1,692 | $58,700 | $0 | $0 |
| 2023 | $1,620 | $50,800 | $0 | $0 |
| 2022 | $2,899 | $42,100 | $0 | $0 |
| 2021 | $2,813 | $36,700 | $0 | $0 |
| 2020 | $1,092 | $34,800 | $0 | $0 |
| 2019 | $1,402 | $29,600 | $0 | $0 |
| 2018 | $1,742 | $0 | $0 | $0 |
| 2017 | $1,646 | $22,276 | $5,176 | $17,100 |
| 2016 | $1,402 | $22,276 | $0 | $0 |
| 2015 | $847 | $20,682 | $0 | $0 |
| 2013 | -- | $19,921 | $0 | $0 |
| 2011 | -- | $24,539 | $0 | $0 |
Source: Public Records
Map
Nearby Homes
- 28319 Waverly St
- 28410 Bohn St
- 28511 Hillview St
- 28222 Bohn St
- 28320 Hillview St
- 28741 Essex St
- 27250 Edward St
- 28767 Maple St
- Vacant Hillview Hillview St
- 28824 Bohn St
- 27639 Bohn St
- 28908 Maple St
- 28919 Essex St
- 17484 Lowell St
- 28703 Groveland St
- 28212 Floral St
- 17970 Lincoln Dr
- 29035 Hillview St
- 17980 Homer St
- 18001 Elizabeth St
- 28333 Felician St
- 28333 Felician St
- 28327 Felician St
- 28343 Felician St
- 28336 Waverly St
- 28319 Felician St
- 28342 Waverly St
- 28351 Felician St
- 28352 Waverly St
- 28311 Felician St
- 0 28333 & Felician & Essex
- 28312 Waverly St
- 28359 Felician St
- 28362 Waverly St
- 28303 Felician St
- 28304 Waverly St
- 28367 Felician St
- 28368 Waverly St
- 28336 Felician St
- 28328 Felician St