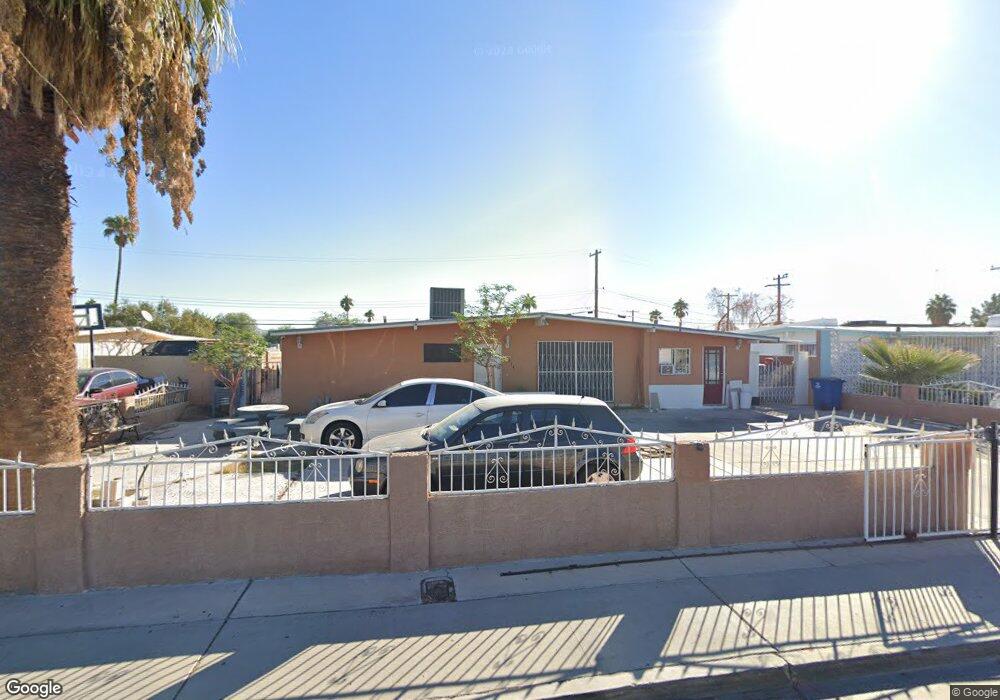
2834 La Canada St Las Vegas, NV 89169
Estimated Value: $340,353 - $387,000
4
Beds
2
Baths
1,341
Sq Ft
$270/Sq Ft
Est. Value
About This Home
This home is located at 2834 La Canada St, Las Vegas, NV 89169 and is currently estimated at $362,088, approximately $270 per square foot. 2834 La Canada St is a home located in Clark County with nearby schools including Robert E Lake Elementary School, Roy West Martin Middle School, and Valley High School.
Ownership History
Date
Name
Owned For
Owner Type
Purchase Details
Closed on
Dec 23, 2011
Sold by
Federal Home Loan Mortgage Corporation
Bought by
Dominguez Guillermo
Current Estimated Value
Purchase Details
Closed on
Sep 10, 2011
Sold by
Gardner Michael and Arias Maria H
Bought by
Federal Home Loan Mortgage Corporation
Purchase Details
Closed on
Sep 1, 2005
Sold by
Gardner Michael and Gardner Maria H
Bought by
Gardner Michael and Arias Maria H
Home Financials for this Owner
Home Financials are based on the most recent Mortgage that was taken out on this home.
Original Mortgage
$151,200
Interest Rate
5.87%
Mortgage Type
Unknown
Purchase Details
Closed on
Mar 24, 1997
Sold by
Alex Tony and Alex Lisa
Bought by
Arias Maria H and Gardner Michael
Home Financials for this Owner
Home Financials are based on the most recent Mortgage that was taken out on this home.
Original Mortgage
$94,130
Interest Rate
8.13%
Mortgage Type
FHA
Create a Home Valuation Report for This Property
The Home Valuation Report is an in-depth analysis detailing your home's value as well as a comparison with similar homes in the area
Home Values in the Area
Average Home Value in this Area
Purchase History
| Date | Buyer | Sale Price | Title Company |
|---|---|---|---|
| Dominguez Guillermo | $40,000 | Lsi Title Agency Inc | |
| Federal Home Loan Mortgage Corporation | $40,920 | Lsi Title Agency Inc | |
| Gardner Michael | -- | Ticor Title Of Nevada Inc | |
| Arias Maria H | $95,000 | Old Republic Title Company |
Source: Public Records
Mortgage History
| Date | Status | Borrower | Loan Amount |
|---|---|---|---|
| Previous Owner | Gardner Michael | $151,200 | |
| Previous Owner | Arias Maria H | $94,130 |
Source: Public Records
Tax History Compared to Growth
Tax History
| Year | Tax Paid | Tax Assessment Tax Assessment Total Assessment is a certain percentage of the fair market value that is determined by local assessors to be the total taxable value of land and additions on the property. | Land | Improvement |
|---|---|---|---|---|
| 2025 | $807 | $47,956 | $28,000 | $19,956 |
| 2024 | $748 | $47,956 | $28,000 | $19,956 |
| 2023 | $748 | $51,175 | $33,250 | $17,925 |
| 2022 | $692 | $44,086 | $28,000 | $16,086 |
| 2021 | $641 | $39,090 | $24,150 | $14,940 |
| 2020 | $593 | $38,684 | $24,150 | $14,534 |
| 2019 | $555 | $33,635 | $19,600 | $14,035 |
| 2018 | $530 | $30,321 | $17,150 | $13,171 |
| 2017 | $835 | $28,457 | $15,400 | $13,057 |
| 2016 | $572 | $21,708 | $9,100 | $12,608 |
| 2015 | $569 | $21,336 | $9,100 | $12,236 |
| 2014 | $633 | $15,902 | $6,300 | $9,602 |
Source: Public Records
Map
Nearby Homes
- 1440 Vegas Valley Dr Unit 3
- 1440 Vegas Valley Dr Unit 2
- 1440 Vegas Valley Dr Unit 1
- 1440 Vegas Valley Dr Unit 6
- 1564 Vegas Valley Dr
- 1420 Vegas Valley Dr Unit 20
- 1420 Vegas Valley Dr Unit 22
- 1628 Izabella Ave
- 1390 Vegas Valley Dr Unit 32
- 1390 Vegas Valley Dr Unit 26
- 1659 Palma Vista Ave
- 1405 Vegas Valley Dr Unit 92
- 1405 Vegas Valley Dr Unit 355
- 1405 Vegas Valley Dr Unit 322
- 1405 Vegas Valley Dr Unit 366
- 1405 Vegas Valley Dr Unit 103
- 1405 Vegas Valley Dr Unit 112
- 1405 Vegas Valley Dr Unit 360
- 1405 Vegas Valley Dr Unit 226
- 1613 Capistrano Ave
- 2824 La Canada St Unit 4
- 2844 La Canada St
- 2835 Coronado Ave
- 2825 Coronado Ave
- 2814 La Canada St
- 2827 La Canada St
- 2837 La Canada St
- 2815 Coronado Ave
- 1549 Coronado Ave
- 2817 La Canada St
- 2864 La Canada St
- 1550 Izabella Ave
- 2807 La Canada St
- 2805 Coronado Ave
- 1491 Corona Ave
- 2866 El Cajon St
- 1563 Coronado Ave
- 1564 Coronado Ave
- 2828 Hermosa St
- 2838 Hermosa St