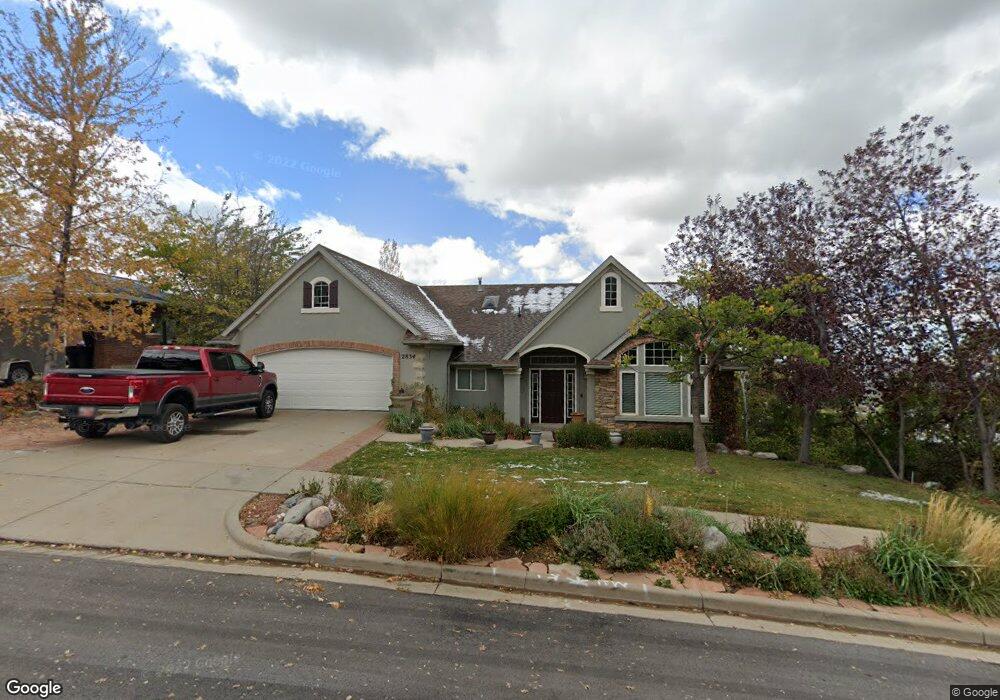
2834 S 650 E Bountiful, UT 84010
Estimated Value: $657,000 - $742,000
4
Beds
3
Baths
1,989
Sq Ft
$358/Sq Ft
Est. Value
About This Home
This home is located at 2834 S 650 E, Bountiful, UT 84010 and is currently estimated at $711,549, approximately $357 per square foot. 2834 S 650 E is a home located in Davis County with nearby schools including Boulton School, Mueller Park Junior High School, and Woods Cross High School.
Ownership History
Date
Name
Owned For
Owner Type
Purchase Details
Closed on
Aug 22, 2008
Sold by
Fogg Steven A and Fogg Marin L
Bought by
Fogg Steven A and Fogg Marin
Current Estimated Value
Home Financials for this Owner
Home Financials are based on the most recent Mortgage that was taken out on this home.
Original Mortgage
$170,000
Outstanding Balance
$111,246
Interest Rate
6.27%
Mortgage Type
New Conventional
Estimated Equity
$600,303
Purchase Details
Closed on
Jan 30, 2001
Sold by
Timberland Inc
Bought by
Fogg Steve A and Fogg Marin L
Home Financials for this Owner
Home Financials are based on the most recent Mortgage that was taken out on this home.
Original Mortgage
$255,200
Interest Rate
7.13%
Purchase Details
Closed on
Dec 8, 2000
Sold by
Drury Lawrence B
Bought by
Timberland Inc
Home Financials for this Owner
Home Financials are based on the most recent Mortgage that was taken out on this home.
Original Mortgage
$255,200
Interest Rate
7.13%
Create a Home Valuation Report for This Property
The Home Valuation Report is an in-depth analysis detailing your home's value as well as a comparison with similar homes in the area
Purchase History
| Date | Buyer | Sale Price | Title Company |
|---|---|---|---|
| Fogg Steven A | -- | Executive Title Ins Agency | |
| Fogg Steve A | -- | Security Title Company | |
| Timberland Inc | -- | Security Title Company |
Source: Public Records
Mortgage History
| Date | Status | Borrower | Loan Amount |
|---|---|---|---|
| Open | Fogg Steven A | $170,000 | |
| Closed | Fogg Steve A | $255,200 |
Source: Public Records
Tax History
| Year | Tax Paid | Tax Assessment Tax Assessment Total Assessment is a certain percentage of the fair market value that is determined by local assessors to be the total taxable value of land and additions on the property. | Land | Improvement |
|---|---|---|---|---|
| 2025 | $730 | $402,600 | $112,085 | $290,515 |
| 2024 | $484 | $383,350 | $103,236 | $280,114 |
| 2023 | $3,931 | $679,000 | $188,575 | $490,425 |
| 2022 | $3,994 | $378,400 | $100,608 | $277,792 |
| 2021 | $3,554 | $515,000 | $149,652 | $365,348 |
| 2020 | $3,077 | $447,000 | $136,236 | $310,764 |
| 2019 | $3,146 | $447,000 | $131,128 | $315,872 |
| 2018 | $3,134 | $440,000 | $122,224 | $317,776 |
| 2016 | $2,657 | $201,795 | $51,148 | $150,647 |
| 2015 | $2,849 | $205,425 | $51,148 | $154,277 |
| 2014 | $2,942 | $218,517 | $51,148 | $167,369 |
| 2013 | -- | $195,862 | $60,349 | $135,513 |
Source: Public Records
Map
Nearby Homes
- 610 Meadowlark Ln
- 438 Indian Springs Rd
- 761 San Simeon Way
- 831 E San Simeon Way S
- 424 E Canyon Estates Dr S
- 2292 S 250 E
- 2136 S 900 E
- 2273 S 200 E
- 993 Canyon Creek Dr
- 69 E North Canyon Rd
- 0 Bountiful Blvd
- 3551 S Huntington Dr
- 320 E 2100 S
- 2156 Elaine Dr
- 2046 S 350 E Unit 4
- 295 E 2050 S Unit 1
- 2038 S 350 E Unit 3
- 110 2250 S
- 296 E 2050 S Unit 2
- 2059 S 350 E Unit 6
Your Personal Tour Guide
Ask me questions while you tour the home.