Estimated Value: $353,000 - $369,000
3
Beds
1
Bath
1,080
Sq Ft
$334/Sq Ft
Est. Value
About This Home
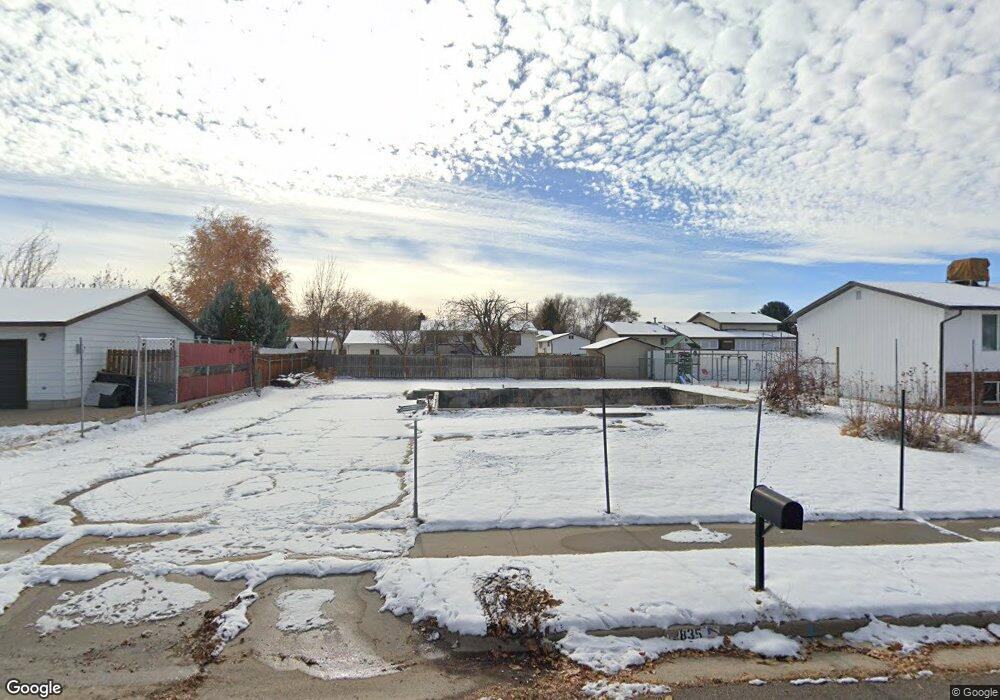
This home is located at 2835 W 4975 S, Roy, UT 84067 and is currently estimated at $361,000, approximately $334 per square foot. 2835 W 4975 S is a home located in Weber County with nearby schools including Midland School, Sand Ridge Junior High School, and Roy High School.
Ownership History
Date
Name
Owned For
Owner Type
Purchase Details
Closed on
Apr 17, 2024
Sold by
Smith Kevin Todd
Bought by
Smith Andrew L
Current Estimated Value
Home Financials for this Owner
Home Financials are based on the most recent Mortgage that was taken out on this home.
Original Mortgage
$407,850
Outstanding Balance
$401,756
Interest Rate
6.88%
Mortgage Type
Credit Line Revolving
Estimated Equity
-$40,756
Purchase Details
Closed on
Apr 12, 2022
Sold by
Smith Andrew L
Bought by
Smith Kevin Todd
Purchase Details
Closed on
Jul 17, 2020
Sold by
Raymond Barbara
Bought by
Smith Andrew L
Purchase Details
Closed on
Jan 7, 2000
Sold by
Allen Pearl T
Bought by
Allen Jamie
Purchase Details
Closed on
Aug 3, 1995
Sold by
Allen Enterprises
Bought by
Allen Pearl T
Create a Home Valuation Report for This Property
The Home Valuation Report is an in-depth analysis detailing your home's value as well as a comparison with similar homes in the area
Home Values in the Area
Average Home Value in this Area
Purchase History
| Date | Buyer | Sale Price | Title Company |
|---|---|---|---|
| Smith Andrew L | -- | Gt Title Services | |
| Smith Kevin Todd | -- | None Listed On Document | |
| Smith Andrew L | -- | Mountain View Title Ogden | |
| Allen Jamie | -- | -- | |
| Allen Pearl T | -- | -- |
Source: Public Records
Mortgage History
| Date | Status | Borrower | Loan Amount |
|---|---|---|---|
| Open | Smith Andrew L | $407,850 |
Source: Public Records
Tax History
| Year | Tax Paid | Tax Assessment Tax Assessment Total Assessment is a certain percentage of the fair market value that is determined by local assessors to be the total taxable value of land and additions on the property. | Land | Improvement |
|---|---|---|---|---|
| 2025 | $1,605 | $130,015 | $130,015 | $0 |
| 2024 | $1,589 | $130,015 | $130,015 | $0 |
| 2023 | $1,474 | $119,753 | $119,753 | $0 |
| 2022 | $1,231 | $100,014 | $100,014 | $0 |
| 2021 | $1,120 | $83,000 | $75,002 | $7,998 |
| 2020 | $1,125 | $77,858 | $75,002 | $2,856 |
| 2019 | $1,638 | $207,000 | $44,989 | $162,011 |
| 2018 | $1,515 | $179,000 | $44,989 | $134,011 |
| 2017 | $1,407 | $155,000 | $44,989 | $110,011 |
| 2016 | $1,399 | $83,152 | $21,944 | $61,208 |
| 2015 | $1,251 | $75,441 | $21,944 | $53,497 |
| 2014 | $1,204 | $71,399 | $21,944 | $49,455 |
Source: Public Records
Map
Nearby Homes
Your Personal Tour Guide
Ask me questions while you tour the home.