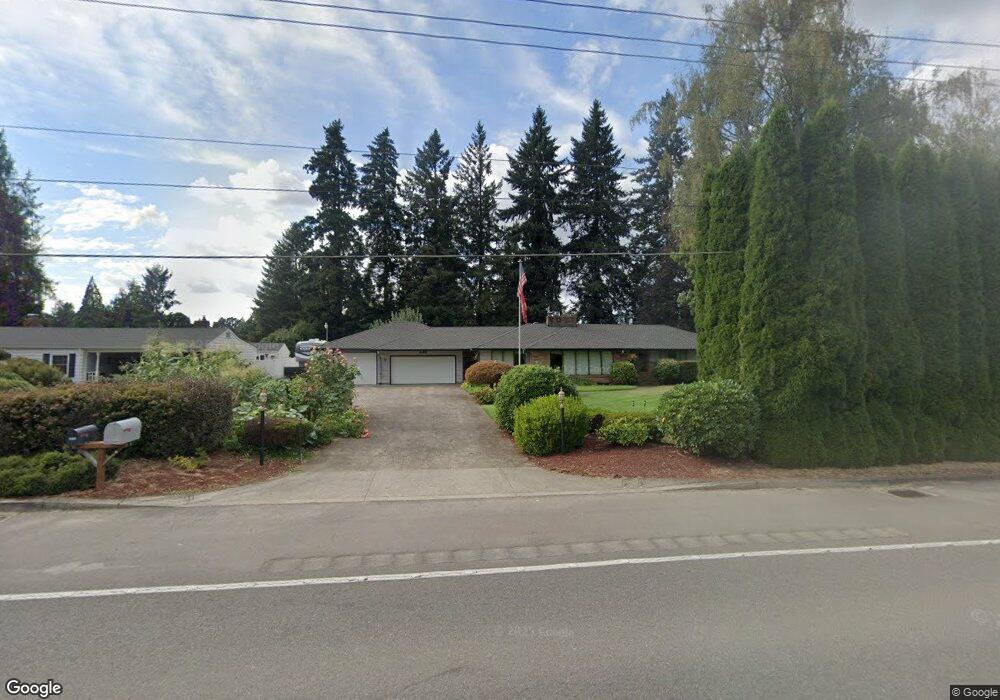
28351 S Highway 213 Molalla, OR 97038
Estimated Value: $674,000 - $930,214
3
Beds
3
Baths
2,968
Sq Ft
$288/Sq Ft
Est. Value
About This Home
This home is located at 28351 S Highway 213, Molalla, OR 97038 and is currently estimated at $854,054, approximately $287 per square foot. 28351 S Highway 213 is a home located in Clackamas County with nearby schools including Country Christian School and Oregon Outreach - Molalla Pride.
Ownership History
Date
Name
Owned For
Owner Type
Purchase Details
Closed on
Oct 5, 2009
Sold by
Aurora Loan Services Llc
Bought by
Browning Richard and Browning Kathleen
Current Estimated Value
Home Financials for this Owner
Home Financials are based on the most recent Mortgage that was taken out on this home.
Original Mortgage
$229,600
Outstanding Balance
$149,776
Interest Rate
5.14%
Mortgage Type
New Conventional
Estimated Equity
$704,278
Purchase Details
Closed on
Jan 29, 2009
Sold by
Dishner Rick A and Dishner Cindy S
Bought by
Aurora Loan Services Llc
Purchase Details
Closed on
May 30, 2003
Sold by
Higginbotham Gary and Henin Jackie
Bought by
Dishner Rick A and Dishner Cindy S
Home Financials for this Owner
Home Financials are based on the most recent Mortgage that was taken out on this home.
Original Mortgage
$320,000
Interest Rate
8.13%
Mortgage Type
Purchase Money Mortgage
Purchase Details
Closed on
Feb 15, 2002
Sold by
Higginbotham Gary and Henin Jackie
Bought by
Department Of Transportation
Create a Home Valuation Report for This Property
The Home Valuation Report is an in-depth analysis detailing your home's value as well as a comparison with similar homes in the area
Home Values in the Area
Average Home Value in this Area
Purchase History
| Date | Buyer | Sale Price | Title Company |
|---|---|---|---|
| Browning Richard | $287,000 | Fidelity Natl Title Co Of Or | |
| Aurora Loan Services Llc | $300,000 | Fatco | |
| Dishner Rick A | $320,000 | Transnation | |
| Department Of Transportation | $3,500 | -- |
Source: Public Records
Mortgage History
| Date | Status | Borrower | Loan Amount |
|---|---|---|---|
| Open | Browning Richard | $229,600 | |
| Previous Owner | Dishner Rick A | $320,000 |
Source: Public Records
Tax History Compared to Growth
Tax History
| Year | Tax Paid | Tax Assessment Tax Assessment Total Assessment is a certain percentage of the fair market value that is determined by local assessors to be the total taxable value of land and additions on the property. | Land | Improvement |
|---|---|---|---|---|
| 2025 | $6,455 | $476,797 | -- | -- |
| 2024 | $6,248 | $462,910 | -- | -- |
| 2023 | $6,248 | $449,428 | $0 | $0 |
| 2022 | $5,218 | $436,338 | $0 | $0 |
| 2021 | $4,980 | $423,630 | $0 | $0 |
| 2020 | $4,843 | $411,292 | $0 | $0 |
| 2019 | $4,703 | $399,313 | $0 | $0 |
| 2018 | $4,574 | $387,683 | $0 | $0 |
| 2017 | $4,319 | $376,391 | $0 | $0 |
| 2016 | $4,051 | $365,428 | $0 | $0 |
| 2015 | $3,936 | $354,784 | $0 | $0 |
| 2014 | $3,775 | $344,450 | $0 | $0 |
Source: Public Records
Map
Nearby Homes
- 28502 S Highway 213
- 28502 Oregon 213
- 14001 S Union Mills Rd
- 13920 S Lucia Ln
- 12403 S Eby Rd
- 15441 S Union Mills Rd
- 0 S Ranch Hills Rd
- 29891 S Highway 213
- 26740 S Fish Rd
- 12051 S Riggs Damm Rd
- 26684 S Fish Rd
- 29333 S Marshall Rd
- 26250 S Milk Creek Cir
- 11600 S Emerson Rd
- 13511 S Freeman Rd
- B2 Plan at River Meadows
- C2 Plan at River Meadows
- A1 Plan at River Meadows
- B2b Plan at River Meadows
- A2 Plan at River Meadows
- 28327 S Highway 213
- 28399 S Highway 213
- 28317 S Highway 213
- 28404 S Highway 213
- 28401 S Highway 213
- 28472 S Highway 213
- 28472 S Highway 213
- 28466 S Highway 213
- 28330 S Highway 213
- 28292 S Highway 213
- 28553 S Highway 213
- 28561 S Highway 213
- 28555 S Highway 213
- 28565 Oregon 213
- 28565 S Hwy 213 Unit 1
- 13823 S MacKsburg Rd
- 13595 S MacKsburg Rd
- 13435 S MacKsburg Rd
- 13889 S MacKsburg Rd
- 13990 S Union Mills Rd