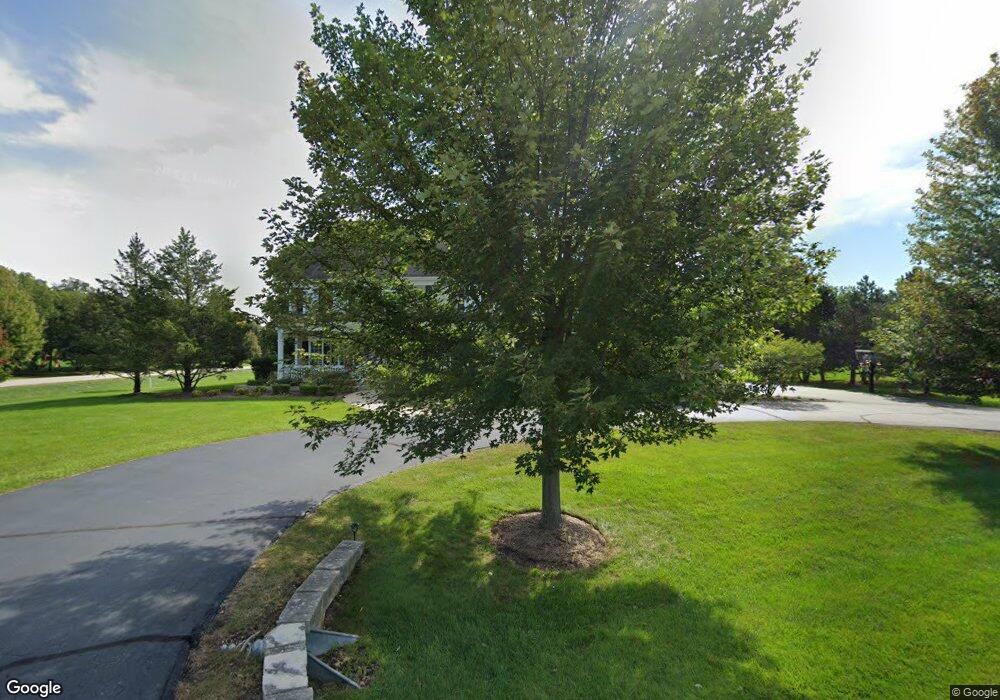
28359 W Harvest Glen Cir Cary, IL 60013
Lyons Prairie NeighborhoodEstimated Value: $832,000 - $1,052,000
4
Beds
5
Baths
3,509
Sq Ft
$260/Sq Ft
Est. Value
About This Home
This home is located at 28359 W Harvest Glen Cir, Cary, IL 60013 and is currently estimated at $913,525, approximately $260 per square foot. 28359 W Harvest Glen Cir is a home located in Lake County with nearby schools including Deer Path Elementary School, Cary Jr High School, and Cary-Grove High School.
Ownership History
Date
Name
Owned For
Owner Type
Purchase Details
Closed on
Jun 21, 2017
Sold by
Slaughter William Kyle and Slaughter Robyn
Bought by
Hennessey Timothy P and Hennessey Katye
Current Estimated Value
Home Financials for this Owner
Home Financials are based on the most recent Mortgage that was taken out on this home.
Original Mortgage
$424,000
Outstanding Balance
$342,385
Interest Rate
3%
Mortgage Type
Adjustable Rate Mortgage/ARM
Estimated Equity
$571,140
Purchase Details
Closed on
Jul 28, 2005
Sold by
Harris Na
Bought by
Slaughter William Kyle and Slaughter Robyn
Home Financials for this Owner
Home Financials are based on the most recent Mortgage that was taken out on this home.
Original Mortgage
$67,000
Interest Rate
6.5%
Mortgage Type
Credit Line Revolving
Create a Home Valuation Report for This Property
The Home Valuation Report is an in-depth analysis detailing your home's value as well as a comparison with similar homes in the area
Home Values in the Area
Average Home Value in this Area
Purchase History
| Date | Buyer | Sale Price | Title Company |
|---|---|---|---|
| Hennessey Timothy P | $566,500 | Heritage Title Company | |
| Slaughter William Kyle | $724,000 | Universal Title Services Inc |
Source: Public Records
Mortgage History
| Date | Status | Borrower | Loan Amount |
|---|---|---|---|
| Open | Hennessey Timothy P | $424,000 | |
| Previous Owner | Slaughter William Kyle | $67,000 | |
| Previous Owner | Slaughter William Kyle | $359,000 |
Source: Public Records
Tax History Compared to Growth
Tax History
| Year | Tax Paid | Tax Assessment Tax Assessment Total Assessment is a certain percentage of the fair market value that is determined by local assessors to be the total taxable value of land and additions on the property. | Land | Improvement |
|---|---|---|---|---|
| 2024 | $17,549 | $237,471 | $36,224 | $201,247 |
| 2023 | $16,083 | $225,091 | $34,336 | $190,755 |
| 2022 | $16,083 | $203,624 | $38,844 | $164,780 |
| 2021 | $16,156 | $200,161 | $38,183 | $161,978 |
| 2020 | $16,178 | $199,542 | $38,065 | $161,477 |
| 2019 | $16,304 | $194,277 | $37,061 | $157,216 |
| 2018 | $16,294 | $191,464 | $60,062 | $131,402 |
| 2017 | $16,431 | $187,297 | $58,855 | $128,442 |
| 2016 | $16,566 | $208,638 | $56,635 | $152,003 |
| 2015 | $19,256 | $195,684 | $53,119 | $142,565 |
| 2014 | $17,329 | $178,240 | $31,627 | $146,613 |
| 2012 | $16,038 | $181,304 | $32,171 | $149,133 |
Source: Public Records
Map
Nearby Homes
- 28413 W Harvest Glen Cir
- 24744 N Golden Oat Cir
- 24881 N Black Walnut
- Lot 7 Hickory Nut Grove Rd
- 24211 N Riverside Dr
- 612 3 Oaks Rd
- 24689 N Fox River Dr
- Lot 11 Park Dr
- 138 Eastwood Ave
- 28876 W Pioneer Grove Rd
- 406 Catkins Way
- 27625 W Kazimour Dr
- Lot 1 N Owl Ct
- 651 S Circle Ave
- 4 Candlewood Ct
- 104 Channel Dr
- 25410 N Cayuga Trail
- 28965 W Roberts Rd
- 28442 W Main St
- 617 Main St
- 28385 W Harvest Glen Cir
- 24835 N Black Walnut
- 24766 N Golden Oat Cir
- 24820 N Wildberry Bend
- 28378 W Harvest Glen Cir
- 28360 W Harvest Glen Cir
- 28396 W Harvest Glen Cir
- 24840 N Black Walnut
- 24867 N Black Walnut
- 24850 N Wildberry Bend
- 28414 W Harvest Glen Cir
- 28449 W Harvest Glen Cir
- 24866 N Black Walnut
- 24740 N Golden Oat Cir
- 28432 W Harvest Glen Cir
- 24745 N Golden Oat Cir
- 24880 N Wildberry Bend
- 24765 N Golden Oat Cir
- 24882 N Black Walnut
- 24815 N Wildberry Bend