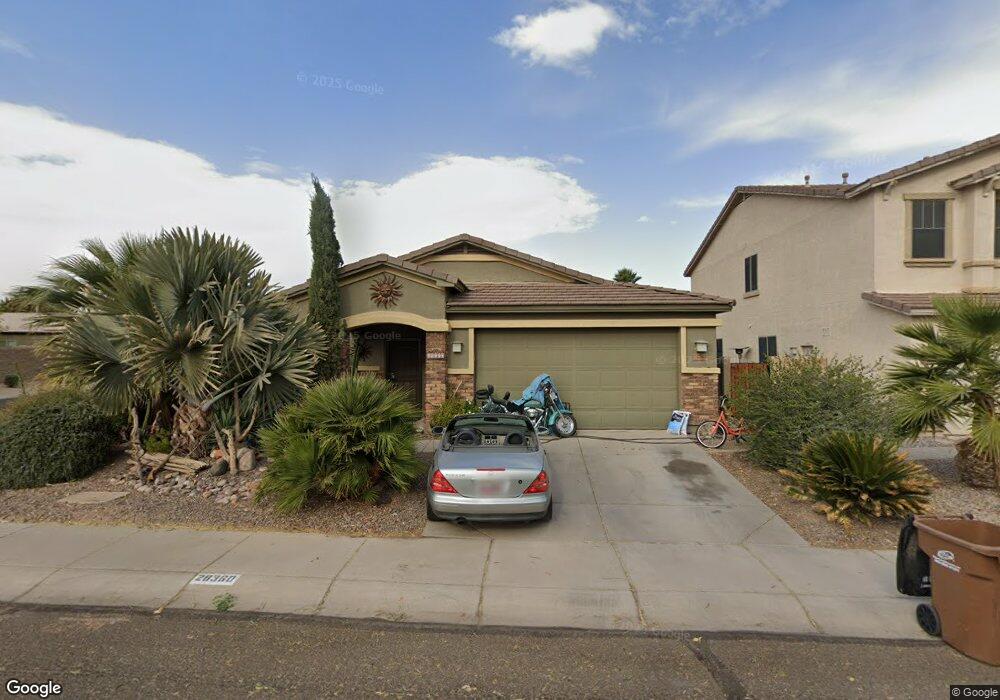
28360 N Castle Rock Dr San Tan Valley, AZ 85143
Johnson Ranch NeighborhoodEstimated Value: $375,675 - $415,000
4
Beds
2
Baths
2,145
Sq Ft
$185/Sq Ft
Est. Value
About This Home
This home is located at 28360 N Castle Rock Dr, San Tan Valley, AZ 85143 and is currently estimated at $396,419, approximately $184 per square foot. 28360 N Castle Rock Dr is a home located in Pinal County with nearby schools including Walker Butte K-8, Poston Butte High School, and Champion Schools San Tan Valley.
Ownership History
Date
Name
Owned For
Owner Type
Purchase Details
Closed on
Dec 15, 2014
Sold by
Durbin James R and Durbin Dona J
Bought by
Rindlisbacher Rodney J and Rindlisbacher Danni T
Current Estimated Value
Home Financials for this Owner
Home Financials are based on the most recent Mortgage that was taken out on this home.
Original Mortgage
$128,000
Outstanding Balance
$96,950
Interest Rate
3.62%
Mortgage Type
New Conventional
Estimated Equity
$299,469
Purchase Details
Closed on
Dec 16, 2011
Sold by
Cajal Willis Michael
Bought by
Durbin James R and Durbin Dona J
Purchase Details
Closed on
Jan 10, 2006
Sold by
Centex Homes
Bought by
Cajal Willis Micheal
Home Financials for this Owner
Home Financials are based on the most recent Mortgage that was taken out on this home.
Original Mortgage
$210,516
Interest Rate
6.25%
Mortgage Type
New Conventional
Create a Home Valuation Report for This Property
The Home Valuation Report is an in-depth analysis detailing your home's value as well as a comparison with similar homes in the area
Home Values in the Area
Average Home Value in this Area
Purchase History
| Date | Buyer | Sale Price | Title Company |
|---|---|---|---|
| Rindlisbacher Rodney J | $158,000 | Magnus Title Agency | |
| Durbin James R | $110,000 | Security Title Agency | |
| Cajal Willis Micheal | $263,146 | Commerce Title Co |
Source: Public Records
Mortgage History
| Date | Status | Borrower | Loan Amount |
|---|---|---|---|
| Open | Rindlisbacher Rodney J | $128,000 | |
| Previous Owner | Cajal Willis Micheal | $210,516 | |
| Closed | Cajal Willis Micheal | $52,629 |
Source: Public Records
Tax History Compared to Growth
Tax History
| Year | Tax Paid | Tax Assessment Tax Assessment Total Assessment is a certain percentage of the fair market value that is determined by local assessors to be the total taxable value of land and additions on the property. | Land | Improvement |
|---|---|---|---|---|
| 2025 | $1,465 | $32,026 | -- | -- |
| 2024 | $1,441 | $35,319 | -- | -- |
| 2023 | $1,465 | $26,516 | $1,250 | $25,266 |
| 2022 | $1,441 | $20,421 | $1,250 | $19,171 |
| 2021 | $1,562 | $18,284 | $0 | $0 |
| 2020 | $1,424 | $17,783 | $0 | $0 |
| 2019 | $1,422 | $16,847 | $0 | $0 |
| 2018 | $1,368 | $14,680 | $0 | $0 |
| 2017 | $1,293 | $14,675 | $0 | $0 |
| 2016 | $1,271 | $14,598 | $1,250 | $13,348 |
| 2014 | -- | $9,021 | $1,000 | $8,021 |
Source: Public Records
Map
Nearby Homes
- 962 E Crimm Rd
- 28232 N Abby Cir
- 706 E Navajo Trail
- 28734 N Coyote Creek Rd
- 511 E Red Mesa Trail
- 28377 N Desert Native St
- 439 E Castle Rock Rd
- 1049 E Pasture Canyon Dr
- 1033 E Pasture Canyon Dr
- 362 E Red Mesa Trail
- 1259 E Desert Springs Way
- 298 E Diamond Trail
- 1222 E Canyon Trail
- 472 E Mule Train Trail
- 209 E Diamond Trail
- 738 E Saddle Way
- 409 E Saddle Way
- 29089 N Mountain View Rd
- 231 E Mule Train Trail
- 13 W Canyon Rock Rd
- 28372 N Castle Rock Dr
- 28384 N Castle Rock Dr
- 28338 N Castle Rock Dr
- 28311 N Crimm Rd
- 872 E Crimm Rd Unit 28
- 28394 N Castle Rock Dr
- 28306 N Crimm Rd
- 28328 N Castle Rock Dr
- 28333 N Crimm Rd
- 884 E Crimm Rd
- 899 E Saddleback Place
- 28314 N Crimm Rd
- 28317 N Castle Rock Dr
- 28406 N Castle Rock Dr
- 28328 N Crimm Rd
- 28316 N Castle Rock Dr
- 913 E Saddleback Place
- 28395 N Crimm Rd
- 898 E Crimm Rd
- 28350 N Crimm Rd