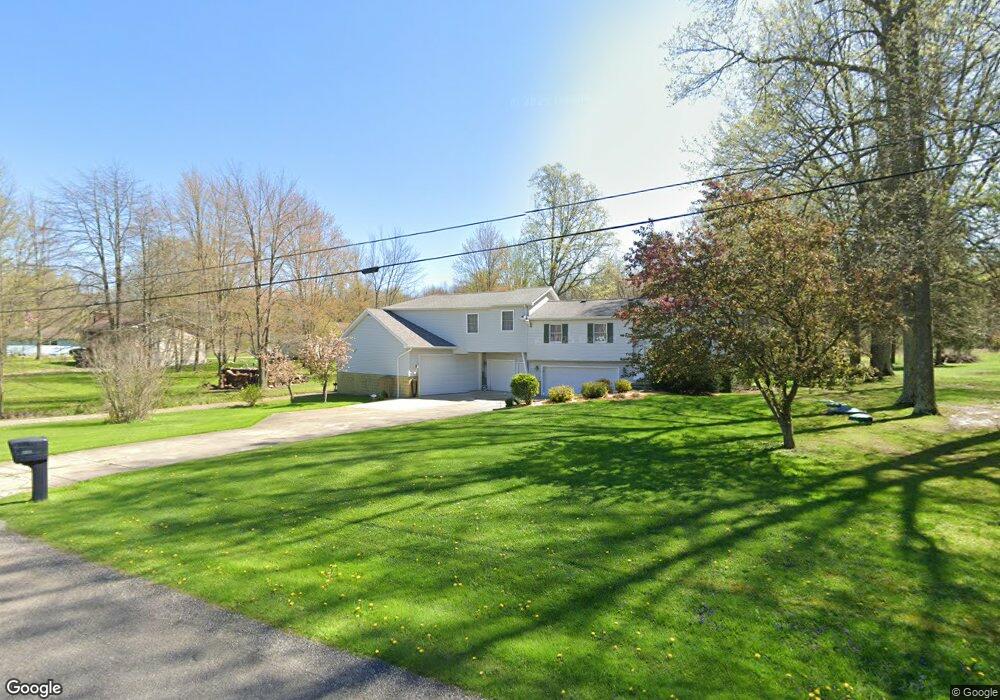
2837 Mahan Denman Rd NW Bristolville, OH 44402
Estimated Value: $264,907 - $331,000
4
Beds
3
Baths
2,184
Sq Ft
$134/Sq Ft
Est. Value
About This Home
This home is located at 2837 Mahan Denman Rd NW, Bristolville, OH 44402 and is currently estimated at $292,227, approximately $133 per square foot. 2837 Mahan Denman Rd NW is a home located in Trumbull County with nearby schools including Bristol Elementary School and Bristol High School.
Ownership History
Date
Name
Owned For
Owner Type
Purchase Details
Closed on
Feb 28, 2013
Sold by
Lanesky Anton P
Bought by
Bryne Quinton A
Current Estimated Value
Home Financials for this Owner
Home Financials are based on the most recent Mortgage that was taken out on this home.
Original Mortgage
$142,373
Outstanding Balance
$99,553
Interest Rate
3.34%
Mortgage Type
FHA
Estimated Equity
$192,674
Purchase Details
Closed on
Nov 1, 2010
Sold by
Lanesky Shannon C
Bought by
Lanesky Anton P
Home Financials for this Owner
Home Financials are based on the most recent Mortgage that was taken out on this home.
Original Mortgage
$142,373
Interest Rate
3.75%
Mortgage Type
FHA
Purchase Details
Closed on
Nov 16, 1998
Sold by
Sersich Carol A
Bought by
Lanesky Anton P and Lanesky Shannon C
Purchase Details
Closed on
Jan 1, 1990
Bought by
Mollie M Burton
Create a Home Valuation Report for This Property
The Home Valuation Report is an in-depth analysis detailing your home's value as well as a comparison with similar homes in the area
Home Values in the Area
Average Home Value in this Area
Purchase History
| Date | Buyer | Sale Price | Title Company |
|---|---|---|---|
| Bryne Quinton A | $145,000 | None Available | |
| Lanesky Anton P | -- | None Available | |
| Lanesky Anton P | $80,000 | -- | |
| Mollie M Burton | -- | -- |
Source: Public Records
Mortgage History
| Date | Status | Borrower | Loan Amount |
|---|---|---|---|
| Open | Bryne Quinton A | $142,373 | |
| Previous Owner | Lanesky Anton P | $142,373 |
Source: Public Records
Tax History Compared to Growth
Tax History
| Year | Tax Paid | Tax Assessment Tax Assessment Total Assessment is a certain percentage of the fair market value that is determined by local assessors to be the total taxable value of land and additions on the property. | Land | Improvement |
|---|---|---|---|---|
| 2024 | $3,162 | $76,830 | $4,380 | $72,450 |
| 2023 | $3,162 | $76,830 | $4,380 | $72,450 |
| 2022 | $2,756 | $62,090 | $4,060 | $58,030 |
| 2021 | $2,762 | $62,090 | $4,060 | $58,030 |
| 2020 | $2,769 | $62,090 | $4,060 | $58,030 |
| 2019 | $2,710 | $55,100 | $3,750 | $51,350 |
| 2018 | $2,727 | $55,100 | $3,750 | $51,350 |
| 2017 | $2,711 | $55,100 | $3,750 | $51,350 |
| 2016 | $2,473 | $51,700 | $3,430 | $48,270 |
| 2015 | $2,470 | $51,700 | $3,430 | $48,270 |
| 2014 | $2,462 | $51,700 | $3,430 | $48,270 |
| 2013 | $2,460 | $51,700 | $3,430 | $48,270 |
Source: Public Records
Map
Nearby Homes
- 2693 Mahan Denman Rd NW
- 2494 Mahan Denman Rd NW
- 6102 Corey Hunt Rd
- 475 Greenville Rd NW
- 288 Bristol Champion NE
- 398 Bristol Champion Townline Rd NW
- 625 Bristol Champion Townline Rd NW
- 5634 N Park Ave
- 634 Bristol Champion Townline Rd NE
- 5110 N Park Ave
- 7434 Fenton Rd NW
- 2271 Peck Leach Rd
- 6388 Brianna Way NW
- 722 Airport Rd NW
- 0 Shaffer Rd NW
- 6227 Mahoning Ave NW
- 4220 N Park Ave
- 6206 Downs Rd NW
- 27 Danbury Ct NW
- 3827 Housel Craft Rd
- 2815 Mahan Denman Rd NW
- 2826 Mahan Denman Rd NW
- 2799 Mahan Denman Rd NW
- 1716 Phelps Rd
- 2810 Mahan Denman Rd NW
- 2794 Mahan Denman Rd NW
- 1732 Phelps Rd
- 2778 Mahan Denman Rd NW
- 1750 Phelps Rd
- 2772 Mahan Denman Rd NW
- 2886 Mahan Denman Rd NW
- 1762 Phelps Rd
- 1757 Phelps Rd
- 1772 Phelps Rd
- 2774 Mahan Denman Rd NW
- 2732 Mahan Denman Rd NW
- 2935 Mahan Denman Rd NW
- 1779 Phelps Rd
- 2716 Mahan Denman Rd NW
- 1802 Phelps Rd