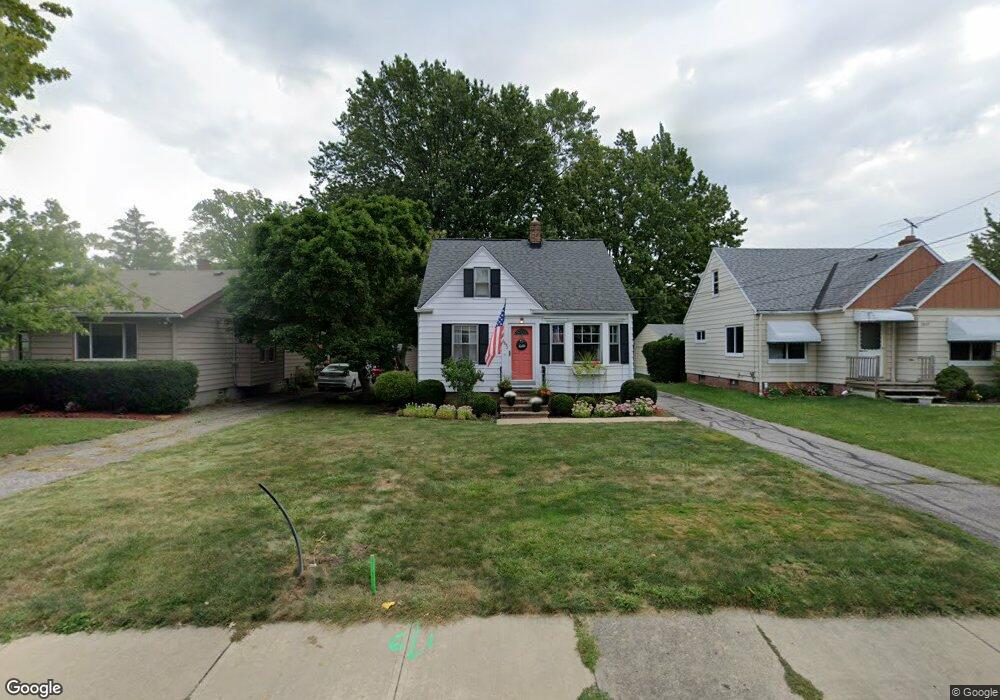
2837 Northview Rd Rocky River, OH 44116
Estimated Value: $267,720 - $345,000
3
Beds
1
Bath
1,168
Sq Ft
$250/Sq Ft
Est. Value
About This Home
This home is located at 2837 Northview Rd, Rocky River, OH 44116 and is currently estimated at $291,930, approximately $249 per square foot. 2837 Northview Rd is a home located in Cuyahoga County with nearby schools including Goldwood Primary Elementary School, Kensington Intermediate Elementary School, and Rocky River Middle School.
Ownership History
Date
Name
Owned For
Owner Type
Purchase Details
Closed on
Aug 1, 2018
Sold by
Mace Kathy B and Mihalski Lawrence J
Bought by
Triplett Christopher G and Triplett Carolyn O
Current Estimated Value
Home Financials for this Owner
Home Financials are based on the most recent Mortgage that was taken out on this home.
Original Mortgage
$147,283
Outstanding Balance
$126,295
Interest Rate
4.5%
Mortgage Type
FHA
Estimated Equity
$165,635
Purchase Details
Closed on
Oct 10, 1989
Sold by
Mace David A
Bought by
Mace Kathy B
Purchase Details
Closed on
Jun 29, 1984
Sold by
Aust Donald E
Bought by
Mace David A
Purchase Details
Closed on
Nov 25, 1977
Sold by
Wehrle Robert G and Wehrle Jean E
Bought by
Aust Donald E
Purchase Details
Closed on
Jan 1, 1975
Bought by
Wehrle Robert G and Wehrle Jean E
Create a Home Valuation Report for This Property
The Home Valuation Report is an in-depth analysis detailing your home's value as well as a comparison with similar homes in the area
Home Values in the Area
Average Home Value in this Area
Purchase History
| Date | Buyer | Sale Price | Title Company |
|---|---|---|---|
| Triplett Christopher G | $150,000 | Ohio Real Title | |
| Mace Kathy B | -- | -- | |
| Mace David A | $56,700 | -- | |
| Aust Donald E | $43,500 | -- | |
| Wehrle Robert G | -- | -- |
Source: Public Records
Mortgage History
| Date | Status | Borrower | Loan Amount |
|---|---|---|---|
| Open | Triplett Christopher G | $147,283 |
Source: Public Records
Tax History
| Year | Tax Paid | Tax Assessment Tax Assessment Total Assessment is a certain percentage of the fair market value that is determined by local assessors to be the total taxable value of land and additions on the property. | Land | Improvement |
|---|---|---|---|---|
| 2025 | $4,494 | $74,655 | $19,810 | $54,845 |
| 2024 | $4,315 | $74,655 | $19,810 | $54,845 |
| 2023 | $3,980 | $52,500 | $17,010 | $35,490 |
| 2022 | $3,804 | $52,500 | $17,010 | $35,490 |
| 2021 | $3,502 | $52,500 | $17,010 | $35,490 |
| 2020 | $4,070 | $52,710 | $12,740 | $39,970 |
| 2019 | $3,678 | $150,600 | $36,400 | $114,200 |
| 2018 | $3,399 | $52,710 | $12,740 | $39,970 |
| 2017 | $3,301 | $44,100 | $13,510 | $30,590 |
| 2016 | $3,213 | $44,100 | $13,510 | $30,590 |
| 2015 | $3,007 | $44,100 | $13,510 | $30,590 |
| 2014 | $3,007 | $39,380 | $12,080 | $27,300 |
Source: Public Records
Map
Nearby Homes
- 2511 Northview Rd
- 3167 Linden Rd Unit 201
- 2745 Wagar Rd
- 20147 Hilliard Blvd
- 3400 Wooster Rd Unit 618
- 3400 Wooster Rd Unit 301
- 9 Westfield Ln
- 3394 Wooster Rd
- 19950 Hilliard Blvd
- 20200 Kramer Dr
- 2885 Pease Dr Unit 127
- 19864 Westover Ave
- 2684 Wooster Rd
- 2736 Pease Dr Unit 215N
- 3605 Glenbar Dr
- 3971 Wooster Rd
- 2948 Pease Dr Unit 204
- 1689 Walnut Ln Unit 5
- 19681 Westover Ave
- 13 Laurel Dr
- 2849 Northview Rd
- 2825 Northview Rd
- 2861 Northview Rd
- 2817 Northview Rd
- 2885 Northview Rd
- 20415 Orchard Grove Ave
- 2812 Northview Rd
- 2830 Northview Rd
- 2838 Northview Rd
- 2935 Northview Rd
- 2741 Northview Rd
- 2822 Northview Rd
- 2854 Northview Rd
- 20387 Orchard Grove Ave
- 20430 Orchard Grove Ave
- 2864 Northview Rd
- 2754 Northview Rd
- 2705 Northview Rd
- 2890 Northview Rd
- 20363 Orchard Grove Ave
Your Personal Tour Guide
Ask me questions while you tour the home.