Estimated Value: $414,911 - $435,000
3
Beds
2
Baths
1,620
Sq Ft
$261/Sq Ft
Est. Value
About This Home
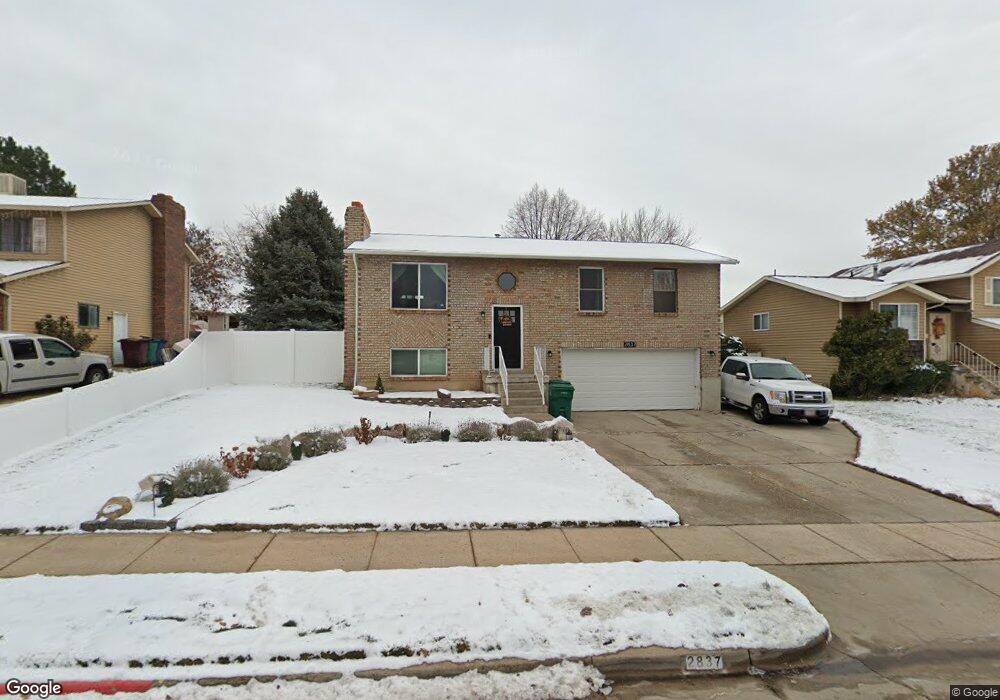
This home is located at 2837 W 4375 S, Roy, UT 84067 and is currently estimated at $422,478, approximately $260 per square foot. 2837 W 4375 S is a home located in Weber County with nearby schools including Midland School, Sand Ridge Junior High School, and Roy High School.
Ownership History
Date
Name
Owned For
Owner Type
Purchase Details
Closed on
Jan 25, 2019
Sold by
Koch Danielle I and Koch Timothy R
Bought by
Lozano Bryan J and Lozano Tracy L
Current Estimated Value
Home Financials for this Owner
Home Financials are based on the most recent Mortgage that was taken out on this home.
Original Mortgage
$223,100
Outstanding Balance
$196,541
Interest Rate
4.6%
Mortgage Type
New Conventional
Estimated Equity
$225,937
Purchase Details
Closed on
Jul 1, 2015
Sold by
Woods Lee D and Woods Tanna
Bought by
Koch Danielle I and Koch Timothy R
Home Financials for this Owner
Home Financials are based on the most recent Mortgage that was taken out on this home.
Original Mortgage
$171,612
Interest Rate
3.81%
Mortgage Type
VA
Purchase Details
Closed on
Aug 23, 2006
Sold by
Taylor Kenneth W and Taylor Mitzi K
Bought by
Woods Lee D and Woods Tanna
Home Financials for this Owner
Home Financials are based on the most recent Mortgage that was taken out on this home.
Original Mortgage
$21,667
Interest Rate
6.33%
Mortgage Type
Stand Alone Second
Create a Home Valuation Report for This Property
The Home Valuation Report is an in-depth analysis detailing your home's value as well as a comparison with similar homes in the area
Home Values in the Area
Average Home Value in this Area
Purchase History
| Date | Buyer | Sale Price | Title Company |
|---|---|---|---|
| Lozano Bryan J | -- | First American Layton | |
| Koch Danielle I | -- | Us Title Insurance Agency | |
| Woods Lee D | -- | First American Title |
Source: Public Records
Mortgage History
| Date | Status | Borrower | Loan Amount |
|---|---|---|---|
| Open | Lozano Bryan J | $223,100 | |
| Previous Owner | Koch Danielle I | $171,612 | |
| Previous Owner | Woods Lee D | $21,667 | |
| Previous Owner | Woods Lee D | $115,560 |
Source: Public Records
Tax History Compared to Growth
Tax History
| Year | Tax Paid | Tax Assessment Tax Assessment Total Assessment is a certain percentage of the fair market value that is determined by local assessors to be the total taxable value of land and additions on the property. | Land | Improvement |
|---|---|---|---|---|
| 2025 | $2,491 | $392,568 | $131,101 | $261,467 |
| 2024 | $2,386 | $207,899 | $72,105 | $135,794 |
| 2023 | $2,251 | $195,800 | $70,326 | $125,474 |
| 2022 | $2,545 | $231,000 | $59,551 | $171,449 |
| 2021 | $2,010 | $298,000 | $73,276 | $224,724 |
| 2020 | $1,815 | $246,000 | $73,276 | $172,724 |
| 2019 | $1,799 | $240,000 | $48,484 | $191,516 |
| 2018 | $1,714 | $206,000 | $43,596 | $162,404 |
| 2017 | $1,557 | $174,000 | $41,653 | $132,347 |
| 2016 | $1,539 | $92,783 | $24,255 | $68,528 |
| 2015 | $1,327 | $80,801 | $24,255 | $56,546 |
| 2014 | $1,259 | $75,271 | $21,415 | $53,856 |
Source: Public Records
Map
Nearby Homes
- 2816 W 4400 S
- 2802 W 4375 S
- 2835 W 4200 S
- 2979 W 4275 S
- 2777 W 4175 S Unit 229
- 2778 W 4175 S Unit 235
- 2642 W 4400 S
- 3084 W 4375 S
- 4635 S 2950 W
- 4118 Westlake Dr
- 4022 S 2725 W
- 3014 W 4750 S
- 1952 W 5450 S
- 2917 W 3970 S Unit 53
- 4440 Stone Creek Rd Unit 2E
- 4670 S 2525 W
- 3891 S 2940 W
- 3866 S 2970 W
- 3046 W 4850 S
- 4510 Stone Creek Rd Unit F