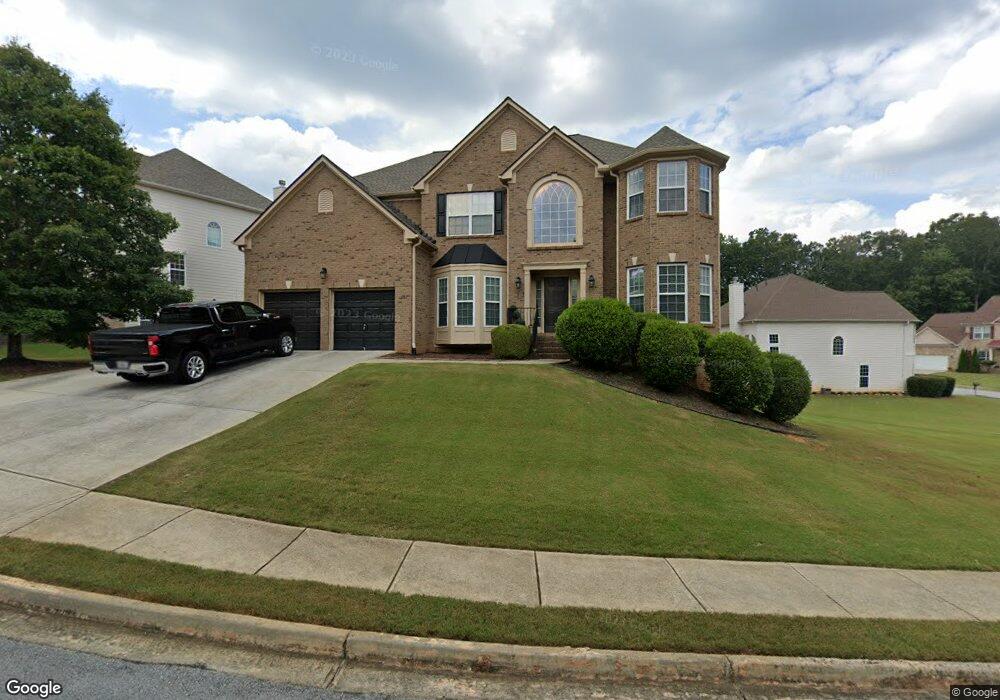
2838 Heritage Oaks Cir Unit 7 Dacula, GA 30019
Estimated Value: $538,916 - $581,000
5
Beds
4
Baths
3,495
Sq Ft
$162/Sq Ft
Est. Value
About This Home
This home is located at 2838 Heritage Oaks Cir Unit 7, Dacula, GA 30019 and is currently estimated at $565,729, approximately $161 per square foot. 2838 Heritage Oaks Cir Unit 7 is a home located in Gwinnett County with nearby schools including Dacula Elementary School, Dacula Middle School, and Dacula High School.
Ownership History
Date
Name
Owned For
Owner Type
Purchase Details
Closed on
Mar 30, 2011
Sold by
Federal Home Loan Mortgage Corporation
Bought by
Richardson Joyon D and Hare Jenaro
Current Estimated Value
Home Financials for this Owner
Home Financials are based on the most recent Mortgage that was taken out on this home.
Original Mortgage
$199,803
Outstanding Balance
$136,526
Interest Rate
4.75%
Mortgage Type
FHA
Estimated Equity
$429,203
Purchase Details
Closed on
Dec 7, 2010
Sold by
American Hm Mtg Servicing Inc
Bought by
Federal Home Loan Mortgage Corporation
Purchase Details
Closed on
Dec 23, 2004
Sold by
Grp Ryland
Bought by
Milis Jade C and Milis Nikolaos
Home Financials for this Owner
Home Financials are based on the most recent Mortgage that was taken out on this home.
Original Mortgage
$295,050
Interest Rate
5.66%
Mortgage Type
New Conventional
Create a Home Valuation Report for This Property
The Home Valuation Report is an in-depth analysis detailing your home's value as well as a comparison with similar homes in the area
Home Values in the Area
Average Home Value in this Area
Purchase History
| Date | Buyer | Sale Price | Title Company |
|---|---|---|---|
| Richardson Joyon D | $205,000 | -- | |
| Federal Home Loan Mortgage Corporation | -- | -- | |
| American Hm Mtg Servicing Inc | $218,000 | -- | |
| Milis Jade C | $310,600 | -- |
Source: Public Records
Mortgage History
| Date | Status | Borrower | Loan Amount |
|---|---|---|---|
| Open | Richardson Joyon D | $199,803 | |
| Previous Owner | Milis Jade C | $295,050 |
Source: Public Records
Tax History Compared to Growth
Tax History
| Year | Tax Paid | Tax Assessment Tax Assessment Total Assessment is a certain percentage of the fair market value that is determined by local assessors to be the total taxable value of land and additions on the property. | Land | Improvement |
|---|---|---|---|---|
| 2025 | $6,608 | $250,360 | $30,000 | $220,360 |
| 2024 | $6,354 | $229,720 | $36,000 | $193,720 |
| 2023 | $6,354 | $225,880 | $36,000 | $189,880 |
| 2022 | $5,761 | $203,040 | $29,600 | $173,440 |
| 2021 | $4,878 | $156,520 | $23,600 | $132,920 |
| 2020 | $4,699 | $146,560 | $23,600 | $122,960 |
| 2019 | $4,252 | $131,720 | $19,200 | $112,520 |
| 2018 | $4,260 | $131,720 | $19,200 | $112,520 |
| 2016 | $3,807 | $110,080 | $16,000 | $94,080 |
| 2015 | $3,838 | $110,080 | $16,000 | $94,080 |
| 2014 | $3,925 | $104,840 | $12,800 | $92,040 |
Source: Public Records
Map
Nearby Homes
- 2879 Heritage Oaks Cir
- 2819 Heritage Oaks Cir Unit 7
- 2818 Stockbridge Way
- 2901 Tree Top Rd
- 2647 Stockbridge Way
- 2693 Austin Ridge Dr
- 2768 Ballyshannon Ct
- 535 Maeve Ln
- 2896 Spence Ct
- 3189 Eastham Run Dr
- 2827 Riders Ct
- 2793 Austin Ridge Dr
- 3472 Fishpond Cir
- 3527 Fishpond Cir
- 3507 Fishpond Cir
- 3557 Fishpond (Lot 95) Cir
- 3472 Fishpond (Lot 8) Cir
- 3422 Fishpond (Lot 13) Cir
- 825 River Cove Dr Unit 1
- 2808 Heritage Oaks Cir Unit 7
- 2878 Heritage Oaks Cir
- 2829 Heritage Oaks Cir
- 2839 Heritage Oaks Cir
- 2798 Heritage Oaks Cir
- 2918 Heritage Oaks Cir
- 2809 Heritage Oaks Cir
- 2869 Heritage Oaks Cir
- 2928 Heritage Oaks Cir Unit 7
- 2788 Heritage Oaks Cir
- 2789 Heritage Oaks Cir Unit 7
- 2889 Heritage Oaks Cir
- 2909 Heritage Oaks Cir Unit IR
- 2909 Heritage Oaks Cir
- 2938 Heritage Oaks Cir
- 2938 Heritage Oaks Cir Unit 12
- 2779 Heritage Oaks Cir
- 2919 Heritage Oaks Cir Unit 7
- 2778 Heritage Oaks Cir Unit 7
- 2929 Heritage Oaks Cir