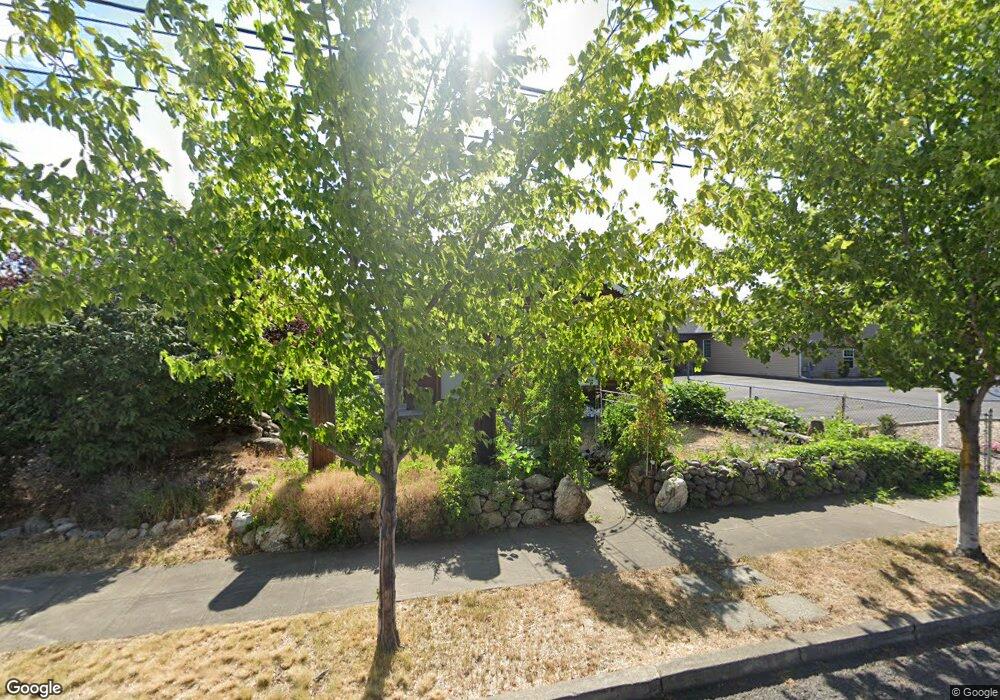
2838 N Ruby St Spokane, WA 99207
Logan NeighborhoodEstimated Value: $281,000 - $377,000
3
Beds
2
Baths
1,354
Sq Ft
$247/Sq Ft
Est. Value
About This Home
This home is located at 2838 N Ruby St, Spokane, WA 99207 and is currently estimated at $334,822, approximately $247 per square foot. 2838 N Ruby St is a home located in Spokane County with nearby schools including Garfield Elementary School, North Central High School, and Glover Middle School.
Ownership History
Date
Name
Owned For
Owner Type
Purchase Details
Closed on
Dec 23, 2004
Sold by
Cottrell Nathan T
Bought by
Viherlahti Jari and Funderburk Viherlahti Laura
Current Estimated Value
Home Financials for this Owner
Home Financials are based on the most recent Mortgage that was taken out on this home.
Original Mortgage
$80,000
Outstanding Balance
$40,144
Interest Rate
5.76%
Mortgage Type
Purchase Money Mortgage
Estimated Equity
$294,678
Purchase Details
Closed on
Dec 2, 2002
Sold by
Cottrell Laura
Bought by
Cottrell Nathan Thomas
Purchase Details
Closed on
Nov 19, 1998
Sold by
Doree Beverly Jean and Doree Beverly J
Bought by
Cottrell Laura
Home Financials for this Owner
Home Financials are based on the most recent Mortgage that was taken out on this home.
Original Mortgage
$72,000
Interest Rate
6.78%
Mortgage Type
Seller Take Back
Create a Home Valuation Report for This Property
The Home Valuation Report is an in-depth analysis detailing your home's value as well as a comparison with similar homes in the area
Home Values in the Area
Average Home Value in this Area
Purchase History
| Date | Buyer | Sale Price | Title Company |
|---|---|---|---|
| Viherlahti Jari | $100,000 | First American Title Ins | |
| Cottrell Nathan Thomas | $80,000 | -- | |
| Cottrell Laura | $72,000 | Transnation Title Ins Co |
Source: Public Records
Mortgage History
| Date | Status | Borrower | Loan Amount |
|---|---|---|---|
| Open | Viherlahti Jari | $80,000 | |
| Previous Owner | Cottrell Laura | $72,000 |
Source: Public Records
Tax History
| Year | Tax Paid | Tax Assessment Tax Assessment Total Assessment is a certain percentage of the fair market value that is determined by local assessors to be the total taxable value of land and additions on the property. | Land | Improvement |
|---|---|---|---|---|
| 2025 | $3,022 | $293,400 | $68,000 | $225,400 |
| 2024 | $3,022 | $304,300 | $58,000 | $246,300 |
| 2023 | $2,693 | $283,800 | $58,000 | $225,800 |
| 2022 | $2,095 | $275,000 | $58,000 | $217,000 |
| 2021 | $1,805 | $151,300 | $36,000 | $115,300 |
| 2020 | $1,609 | $129,800 | $30,000 | $99,800 |
| 2019 | $1,557 | $130,000 | $30,000 | $100,000 |
| 2018 | $1,811 | $130,000 | $30,000 | $100,000 |
| 2017 | $1,779 | $130,000 | $30,000 | $100,000 |
| 2016 | $1,794 | $128,300 | $30,000 | $98,300 |
| 2015 | $1,833 | $128,300 | $30,000 | $98,300 |
| 2014 | -- | $130,800 | $30,000 | $100,800 |
| 2013 | -- | $0 | $0 | $0 |
Source: Public Records
Map
Nearby Homes
- 206 W Waverly Place
- 511 E Euclid Ave
- 117 E Glass Ave
- 438 W Cleveland Ave
- 19 E Gordon Ave
- 511 E Carlisle Ave
- 3603 N Atlantic St
- 517 E Courtland Ave
- 427 E Glass Ave
- 603 E Liberty Ave
- 108 W Mansfield Ave
- 503 E Montgomery Ave
- 3608 N Calispel St
- 429 E Gordon Ave
- 407 W Gordon Ave
- 817 E North Foothills Dr
- 807 E Euclid Ave
- 2405 N Cincinnati St Unit 2411 N Cincinnati St
- 512 W Montgomery Ave
- 228 E Baldwin Ave
- 2832 N Ruby St
- 2831 N Mayfair St
- 107 E Cleveland Ave
- 2823 N Mayfair St
- 2824 N Ruby St
- 113 E Cleveland Ave
- 2817 N Mayfair St
- 2818 N Ruby St
- 2811 N Mayfair St
- 2814 N Ruby St
- 2807 N Mayfair St
- 2915 N Mayfair St
- 2808 N Ruby St
- 43 E Cora Ave
- 2803 N Mayfair St
- 2919 N Mayfair St
- 155 E Cleveland Ave Unit 201
- 155 E Cleveland Ave
- 155 E Cleveland Ave Unit 203
- 155 E Cleveland Ave Unit 208