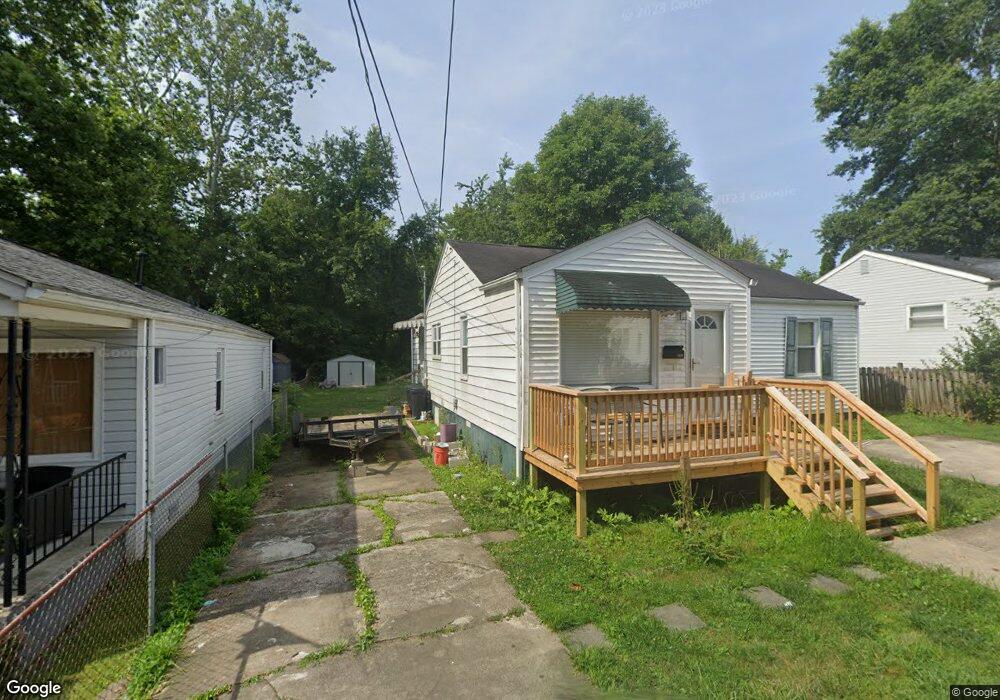
2839 Berkeley Ave Saint Albans, WV 25177
Estimated Value: $116,135 - $130,000
3
Beds
1
Bath
1,108
Sq Ft
$114/Sq Ft
Est. Value
About This Home
This home is located at 2839 Berkeley Ave, Saint Albans, WV 25177 and is currently estimated at $125,784, approximately $113 per square foot. 2839 Berkeley Ave is a home located in Kanawha County with nearby schools including Alban Elementary School, McKinley Middle School, and Saint Albans High School.
Ownership History
Date
Name
Owned For
Owner Type
Purchase Details
Closed on
May 28, 2015
Sold by
Davis Ashley D
Bought by
Burke Michael A and Lacy Brianna N
Current Estimated Value
Home Financials for this Owner
Home Financials are based on the most recent Mortgage that was taken out on this home.
Original Mortgage
$63,750
Outstanding Balance
$49,199
Interest Rate
3.65%
Mortgage Type
New Conventional
Estimated Equity
$76,585
Purchase Details
Closed on
Sep 27, 2011
Sold by
Golden & Amos Pllc
Bought by
Davis Joseph and Briscoe Ashley
Purchase Details
Closed on
Jun 20, 2011
Sold by
Golden And Amos Pllc
Bought by
Federal Home Loan Mortgage Corporation
Purchase Details
Closed on
Mar 30, 2007
Sold by
Keiffer Realty
Bought by
Sheppard Kelly A
Home Financials for this Owner
Home Financials are based on the most recent Mortgage that was taken out on this home.
Original Mortgage
$80,000
Interest Rate
6.33%
Mortgage Type
New Conventional
Create a Home Valuation Report for This Property
The Home Valuation Report is an in-depth analysis detailing your home's value as well as a comparison with similar homes in the area
Home Values in the Area
Average Home Value in this Area
Purchase History
| Date | Buyer | Sale Price | Title Company |
|---|---|---|---|
| Burke Michael A | $73,000 | -- | |
| Davis Joseph | -- | -- | |
| Federal Home Loan Mortgage Corporation | $69,969 | -- | |
| Sheppard Kelly A | $80,800 | -- |
Source: Public Records
Mortgage History
| Date | Status | Borrower | Loan Amount |
|---|---|---|---|
| Open | Burke Michael A | $63,750 | |
| Previous Owner | Sheppard Kelly A | $80,000 |
Source: Public Records
Tax History Compared to Growth
Tax History
| Year | Tax Paid | Tax Assessment Tax Assessment Total Assessment is a certain percentage of the fair market value that is determined by local assessors to be the total taxable value of land and additions on the property. | Land | Improvement |
|---|---|---|---|---|
| 2024 | $739 | $45,240 | $8,880 | $36,360 |
| 2023 | $702 | $42,960 | $8,880 | $34,080 |
| 2022 | $664 | $40,620 | $8,880 | $31,740 |
| 2021 | $665 | $40,680 | $8,880 | $31,800 |
| 2020 | $667 | $40,800 | $8,880 | $31,920 |
| 2019 | $668 | $40,860 | $8,880 | $31,980 |
| 2018 | $611 | $40,860 | $8,880 | $31,980 |
| 2017 | $612 | $40,860 | $8,880 | $31,980 |
| 2016 | $614 | $40,920 | $8,880 | $32,040 |
| 2015 | $614 | $40,980 | $8,880 | $32,100 |
| 2014 | $604 | $40,920 | $8,880 | $32,040 |
Source: Public Records
Map
Nearby Homes
- 2720 Knox Ave
- 2708 Monroe Ave
- 816 Shrewsbury Dr
- 2522 Washington Ave
- 204 4th St E
- 2508 Washington Ave
- 2409 Mckinley Ave
- 6 Squires Dr
- 2400 Harrison Ave
- 3211 Georges Dr
- 35 Sapphire Rd
- 3223 Georges Dr
- 2318 Monroe Ave
- 2316 Jefferson Ave
- 1203 Summit Ct
- 2301 Jefferson Ave
- 2301 Mckinley Ave
- 1138 Summit Dr
- 863 Valley Pike Dr
- 2121 Wilson Ave
- 2841 Berkeley Ave
- 2837 Berkeley Ave
- 2836 Berkeley Ave
- 2834 Berkeley Ave
- 2838 Berkeley Ave
- 2831 Berkeley Ave
- 2829 Berkeley Ave
- 223 Alameda St
- 2825 Berkeley Ave
- 221 Alameda St
- 219 Alameda St
- 209 Richmond St
- 212 Alameda St
- 2821 Berkeley Ave
- 2819 Berkeley Ave
- 215 Alameda St
- 2820 Berkeley Ave
- 208 Alameda St
- 2826 Lincoln Ave
- 206 Alameda St