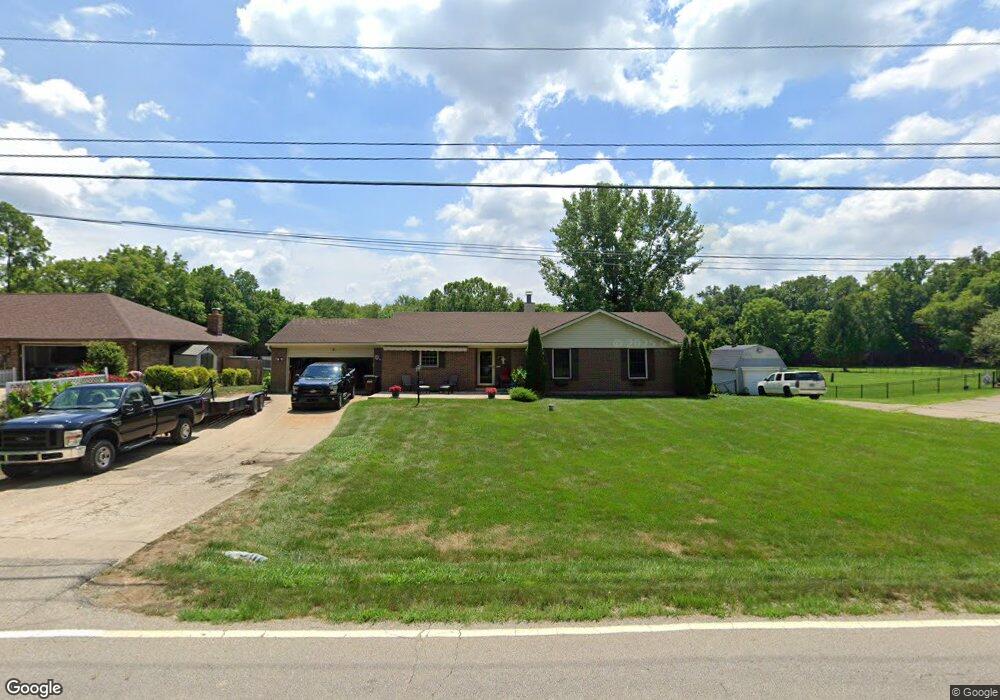
2839 W Lower Springboro Rd Springboro, OH 45066
Estimated Value: $312,000 - $430,000
3
Beds
2
Baths
1,577
Sq Ft
$228/Sq Ft
Est. Value
About This Home
This home is located at 2839 W Lower Springboro Rd, Springboro, OH 45066 and is currently estimated at $359,428, approximately $227 per square foot. 2839 W Lower Springboro Rd is a home located in Warren County with nearby schools including Clearcreek Elementary School, Springboro Intermediate School, and Dennis Elementary School.
Ownership History
Date
Name
Owned For
Owner Type
Purchase Details
Closed on
Mar 25, 2004
Sold by
Household Realty Corp
Bought by
Cramer Robert J
Current Estimated Value
Home Financials for this Owner
Home Financials are based on the most recent Mortgage that was taken out on this home.
Original Mortgage
$155,000
Outstanding Balance
$76,622
Interest Rate
6.5%
Mortgage Type
Purchase Money Mortgage
Estimated Equity
$282,806
Purchase Details
Closed on
Jan 22, 2004
Sold by
Rank Everett and Mortgage Electronic Registrati
Bought by
Household Realty Corp and Household Finance Corp
Purchase Details
Closed on
Feb 14, 2001
Sold by
Staton Garland
Bought by
Rank Everett
Home Financials for this Owner
Home Financials are based on the most recent Mortgage that was taken out on this home.
Original Mortgage
$158,400
Interest Rate
8.75%
Mortgage Type
New Conventional
Purchase Details
Closed on
Feb 10, 1987
Sold by
Staton Garland G and Staton Elou
Bought by
Staton and Staton Garland G
Create a Home Valuation Report for This Property
The Home Valuation Report is an in-depth analysis detailing your home's value as well as a comparison with similar homes in the area
Home Values in the Area
Average Home Value in this Area
Purchase History
| Date | Buyer | Sale Price | Title Company |
|---|---|---|---|
| Cramer Robert J | $155,000 | Triad Title Agency Inc | |
| Household Realty Corp | $115,000 | -- | |
| Rank Everett | $140,893 | -- | |
| Staton | -- | -- |
Source: Public Records
Mortgage History
| Date | Status | Borrower | Loan Amount |
|---|---|---|---|
| Open | Cramer Robert J | $155,000 | |
| Previous Owner | Rank Everett | $158,400 |
Source: Public Records
Tax History Compared to Growth
Tax History
| Year | Tax Paid | Tax Assessment Tax Assessment Total Assessment is a certain percentage of the fair market value that is determined by local assessors to be the total taxable value of land and additions on the property. | Land | Improvement |
|---|---|---|---|---|
| 2024 | $3,041 | $84,220 | $24,150 | $60,070 |
| 2023 | $2,581 | $66,251 | $12,915 | $53,336 |
| 2022 | $2,542 | $66,252 | $12,915 | $53,337 |
| 2021 | $2,376 | $66,252 | $12,915 | $53,337 |
| 2020 | $2,138 | $53,862 | $10,500 | $43,362 |
| 2019 | $1,982 | $53,862 | $10,500 | $43,362 |
| 2018 | $1,971 | $53,862 | $10,500 | $43,362 |
| 2017 | $2,022 | $50,194 | $9,940 | $40,254 |
| 2016 | $2,104 | $50,194 | $9,940 | $40,254 |
| 2015 | $2,099 | $50,194 | $9,940 | $40,254 |
| 2014 | $2,469 | $44,820 | $8,880 | $35,940 |
| 2013 | $2,469 | $53,010 | $10,500 | $42,510 |
Source: Public Records
Map
Nearby Homes
- 45 Libby Hollow St
- 45 Ed Knoll Bend
- 40 Libby Hollow St
- 5 Annie Grove Ln
- 140 Dan Haven Place
- 15 Wadestone Ln
- Calvin Plan at Wadestone - Designer Collection
- Charles Plan at Wadestone - Designer Collection
- Charles Plan at Eastbrook Farms - Designer Collection
- Huxley Plan at Wadestone - Masterpiece Collection
- Wyatt Plan at Wadestone - Designer Collection
- Calvin Plan at Eastbrook Farms - Designer Collection
- Winston Plan at Wadestone - Designer Collection
- Grandin Plan at Eastbrook Farms - Designer Collection
- Magnolia Plan at Eastbrook Farms - Designer Collection
- Avery Plan at Eastbrook Farms - Designer Collection
- Rhodes Plan at Wadestone - Masterpiece Collection
- Finley Plan at Wadestone - Masterpiece Collection
- Blair Plan at Wadestone - Designer Collection
- Emmett Plan at Eastbrook Farms - Designer Collection
- 2831 W Lower Springboro Rd
- 2847 W Lower Springboro Rd
- 2889 W Lower Springboro Rd
- 2800 W Lower Springboro Rd
- 2789 W Lower Springboro Rd
- 2802 W Lower Springboro Rd
- 2925 W Lower Springboro Rd
- 2927 W Lower Springboro Rd
- 7228 Quarterhorse Dr
- 7176 Quarterhorse Dr
- 2928 W Lower Springboro Rd
- 7132 Quarterhorse Dr
- 2595 W Lower Springboro Rd
- 7114 Quarterhorse Dr
- 2867 Factory Rd
- 7197 Quarterhorse Dr
- 2964 W Lower Springboro Rd
- 2964 Factory Rd
- Lot 9, Aut Hemingway Dr
- Lot 3 Aute Hemingway Dr